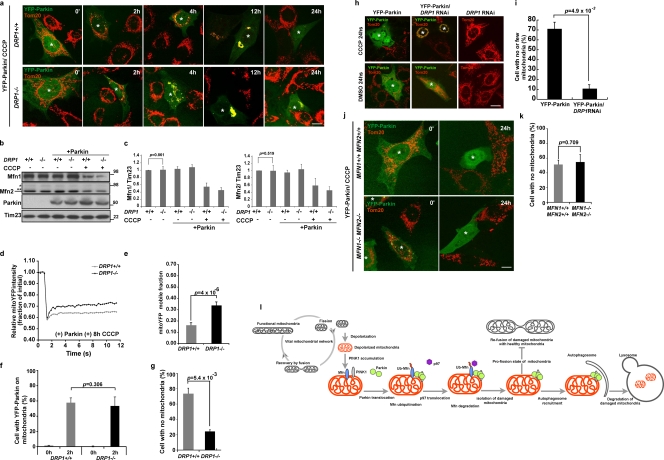
Figure 8.
Mitochondrial fission is required for Parkin-mediated mitophagy. (a) MEFs from DRP1+/+ or DRP1−/− mice were transiently transfected with YFP-Parkin. Cells were treated with CCCP and then immunostained with anti-Tom20. Cells expressing YFP-Parkin are indicated with asterisks. CCCP, 20 µM. Bar, 10 µm. (b) Whole cell lysates from DRP1+/+ or DRP1−/− MEFs with or without transient expression of Parkin were subjected to SDS-PAGE. Molecular mass is indicated in kilodaltons next to the gel blots. (c) The average of the Mfn1 or Mfn2 level normalized to the level of Tim23 is presented with the standard deviation indicated by the error bars. Each graph was generated from three independent experiments from b. The protein levels in control (nontreated, nontransfected) cells were set as 1. (d) Clumping mitochondria in DRP1+/+ or DRP1−/− MEFs transiently expressing mCherry-Parkin and Mito-YFP were subjected to the FRAP assay. The curve represents an average of 30 individual FRAP curves. CCCP, 20 µM for 8 h. (e) The mobile fractions of Mito-YFP in d. (f and g) YFP-Parkin translocation (f) and YFP-Parkin–induced mitophagy (g) in DRP1+/+ or DRP1−/− MEFs treated with CCCP as in panel a were quantified (n > 50). CCCP, 20 µM for 24 h. Data represent the mean ± SD with P values of at least three replicates. (h) HeLa cells treated with DRP1 shRNA or control HeLa cells were transiently transfected with YFP-Parkin and treated with or without CCCP. Mitochondria were immunostained with anti-Tom20. Cells expressing YFP-Parkin are indicated with asterisks. CCCP, 10 µM for 24 h. Bar, 10 µm. (i) YFP-Parkin–induced mitophagy in HeLa cells with or without DRP1 RNAi as in h was quantified (n > 50). CCCP, 10 µM for 24 h. Data represent the mean ± SD with P values of at least three replicates. (j and k) YFP-Parkin–induced mitophagy in MFN1+/+2+/+ MEFs or MFN1−/−2−/− MEFs was observed (j) and quantified (k) (n > 50). CCCP, 20 µM for 24 h. Data represent the mean ± SD with P values of at least three replicates. Cells expressing YFP-Parkin are indicated with asterisks. (l) A model for Parkin-mediated Mfn degradation and mitophagy. Depolarized mitochondria (orange) that accumulated PINK1 (gray) are sensed by Parkin (green). After Parkin recruitment to the damaged mitochondria, mitochondrial Parkin induces mitofusin (blue) ubiquitination and degradation. Degradation of mitofusin is regulated by p97 (purple) and is important to prevent impaired mitochondria from fusing with the vital mitochondrial network. Damaged mitochondria isolated by Parkin are engaged with autophagosomes and eliminated by auto-lysosomes.

