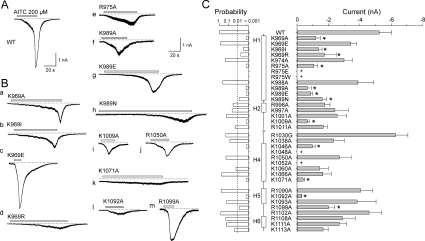
Figure 2. Screen of the C-terminus of human TRPA1 for AITC sensitivity.
(A and B) Examples of whole-cell currents elicited by 200 μM AITC from HEK-293T cells transiently transfected with (A) wild-type (WT) TRPA1 or (B, panels a–m) mutant TRPA1 channels that exhibited the most prominent phenotypic changes. Broken lines indicate zero current level. Horizontal bars above each record indicate the duration of AITC application. Holding potential −70 mV. (C) Summary of scanning mutagenesis results comparing sensitivity to AITC. The right histogram shows mean whole-cell currents evoked by 200 μM AITC at −70 mV measured at the peak for each construct. Each bar is the means±S.E.M. of at least six independent cells. The left histogram represents the probabilities obtained from the t tests that were performed in order to determine if there was a significant difference between the responses of the wild-type and the individual mutants. The level of significance is indicated with a broken vertical line in the left probability histogram. Statistical significance (P<0.01) is indicated with asterisks in the right current histogram. The plus signs indicate positions where mutations resulted in constructs lacking functional expression in HEK-293T cells. The predicted secondary structure is indicated in the middle as vertical thick bars (α-helices H1, H2, H4–H6).

