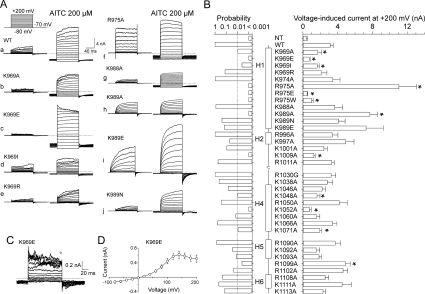
Figure 3. Voltage-dependent gating of TRPA1 mutants.
(A) Representative current traces in response to the indicated voltage step protocol (holding potential, −70 mV; voltage steps from −80 mV to +200 mV; increment +20 mV) recorded in control extracellular solution (left) and in the presence of 200 μM AITC (right). (B) Summary of mutagenesis results. Average steady-state whole-cell currents induced by voltage (+200 mV). Each bar is the means±S.E.M. of at least six independent cells. The predicted secondary structure is indicated in the middle as vertical thick bars (α-helices H1, H2, H4–H6). The left histogram represents the probabilities obtained from the t tests that compared the steady-state current amplitudes of the individual mutants with the wild-type (WT). The level of significance is indicated with a broken vertical line in the left probability histogram. Statistical significance (P<0.01) is indicated with asterisks in the right current histogram. (C) Representative whole-cell currents evoked by the voltage protocol (shown in A) applied in control extracellular solution, recorded in the K969E mutant. (D) Averaged voltage–current relationship constructed from responses obtained from eight independent recordings such as shown in (C), measured at the end of the pulses (indicated above the records in C). Results are means±S.E.M. NT, non-transfected HEK-293T cells.

