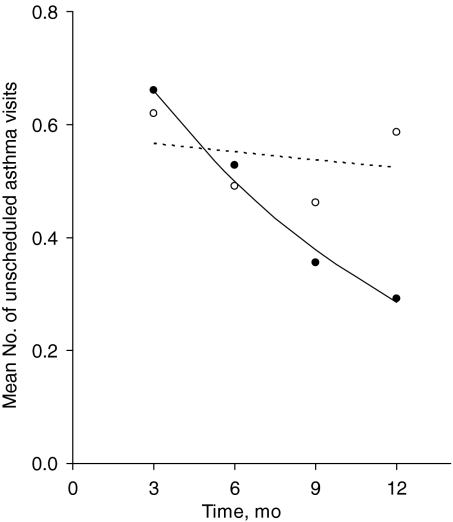
FIGURE 2.
Mean numbers of unscheduled asthma visits in the previous 3 months, reported at quarterly intervals during the trial, according to group assignment, with adjustment for differences in the numbers of unscheduled asthma visits at baseline. The solid line and closed circles indicate the intervention group; dashed line and open circles, control group.

