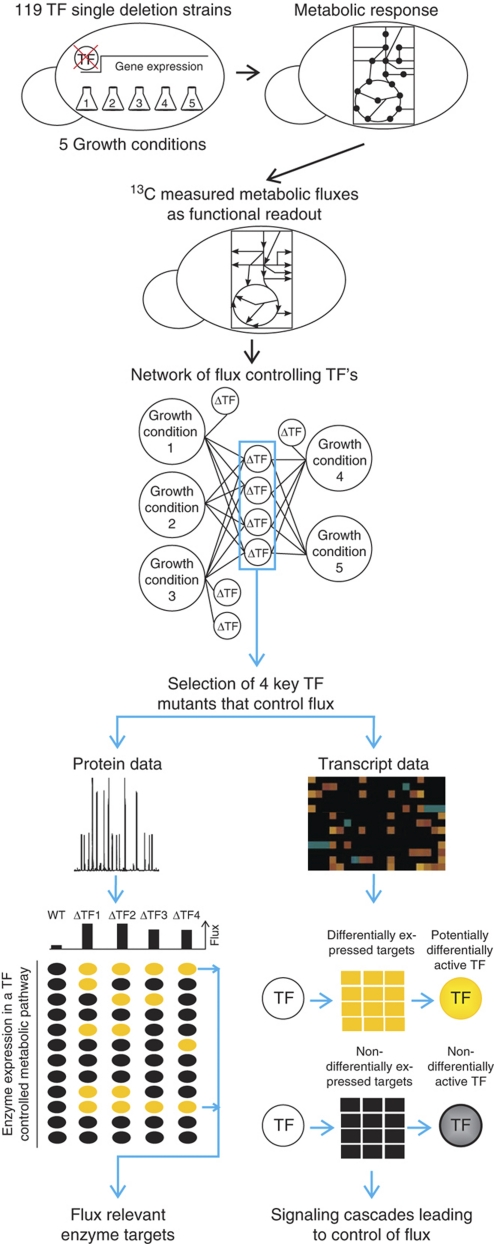
Figure 1.
Schematic overview on the performed experiments and data analysis. Yellow ellipses and squares indicate altered protein and gene expression in transcription factor mutants compared with the wild type, respectively. Black ellipses and squares indicate no difference between mutant and wild type.

