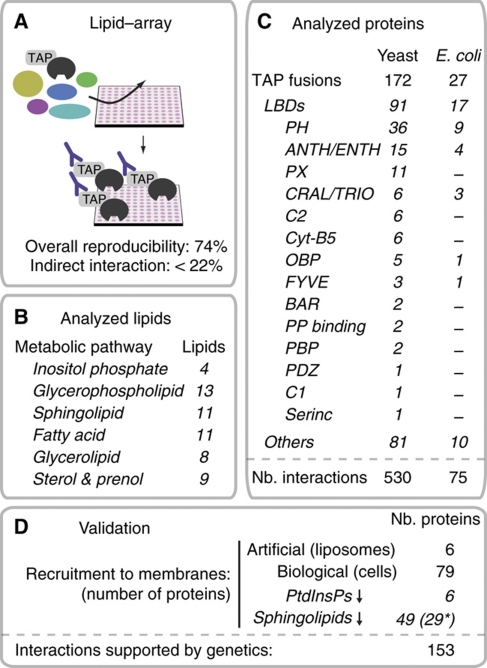
Figure 1.
Identification of protein–lipid interactions in S. cerevisiae using lipid–arrays and live-cell imaging. (A) Charting protein–lipid interactions with lipid–arrays. (B) Summary of the different lipids analyzed. Lipids are grouped according to their metabolic pathways. Numbers of different lipids analyzed for each pathway are indicated. (C) Summary of the different proteins analyzed. Proteins are grouped according to their LBDs. For each category, the numbers of proteins analyzed are indicated. (D) Summary of the validation procedure. The number of proteins analyzed in each assay is represented. Asterisk points to the series of 29 proteins that bound PtdInsPs (and not sphingolipids) and that we used as control.

