Figure 3.
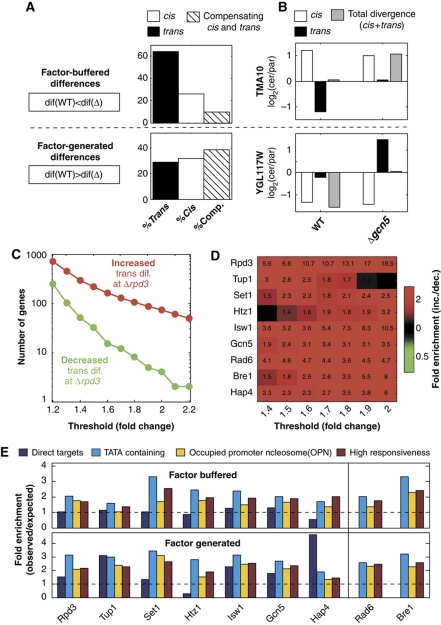
The cis and trans contribution to expression differences and their buffering. (A) The cis and trans effects were quantified in the wild-type and mutant strains by analyzing the respective interspecific hybrids. Factor-buffered (top) and factor-generated variations (bottom) were classified into changes in the extent of a cis effect, trans effect or compensation between cis and trans: genes in which the change in a cis and/or trans effect is opposite to the change in overall expression difference due to cis–trans compensation (Comp.). Shown are the percentages of these classes, averaged over the nine different mutants. (B) Examples of cis–trans compensation for factor-buffered (top, TMA10) and factor-generated differences (bottom, YGL117W). (C, D) Enrichment of increased over decreased interspecies expression differences for Δrpd3 (C) and for all deletion strains (D). The same analysis was performed as in Figure 2, but restricted to the trans component of interspecies expression differences. Numbers are shown over the heatmap only for values above 1.3 or below 0.7. (E) Fold enrichment of factor-buffered (top) and factor-generated (bottom) variations with the direct targets of each factor (blue; unknown direct targets for Bre1 and Rad6), TATA-containing genes (light blue; Basehoar et al, 2004), OPN genes (yellow; Tirosh and Barkai, 2008) and genes with high responsiveness (red; third of the genes with highest responsiveness, as previously defined; Tirosh and Barkai, 2008). Fold enrichment was calculated as the percentage of factor-buffered/generated genes with the corresponding property divided by the percentage of all genes with that property.

