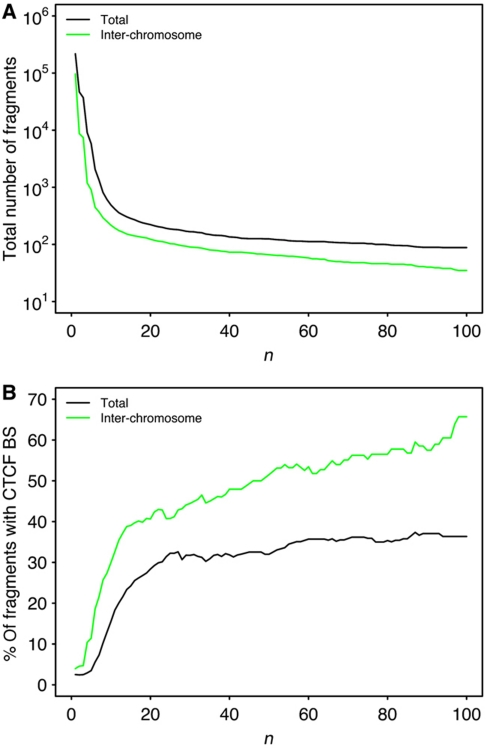
Figure 2.
CTCF presence is correlated with the most frequently observed interactions in the human genome. (A) Number of fragments that are present in at least n interaction reads in the Hi-C experiments on lymphoblastoid cell line (log scale on the y-axis). In black, all interactions are considered. In green, only inter-chromosomal interactions are considered. (B) The percentage of interacting fragments that contain at least one CTCF site is presented as a function of n. In black, all interactions are considered. In green, only interchromosomal interactions are considered.

