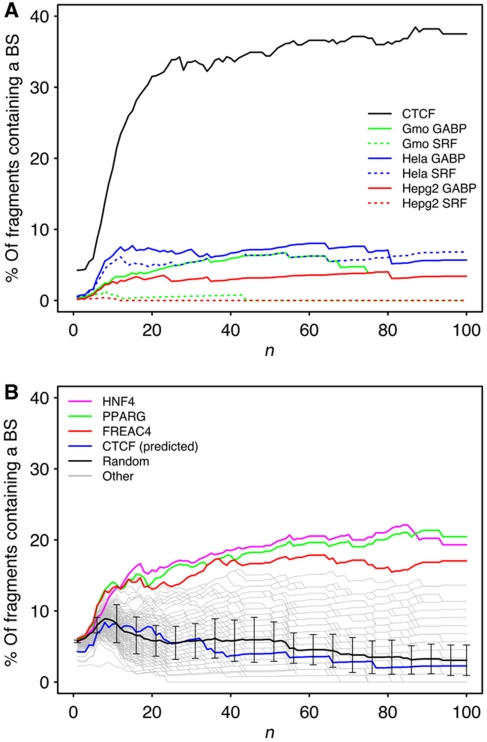
Figure 4.
Correlation between strongly interacting fragments and the presence of specific DNA-binding factors. (A) CTCF versus other ChIP-Seq data sets. SRF and GABP genomic locations were mapped on three different cell types: in red, Hep G2 cells; in blue, HeLa cells and in green, lymphoblastoid cells. (B) Same analysis conducted with computationally predicted binding sites for transcription factors from the TRANSFAC database. The black line and error bars correspond to random sequences of 20 bp (see Materials and methods section).

