
Figure 5. Skeletal muscle PPARα, PPARβ/δ and PPARγ mRNA (A, B and C) and protein content (D, E and F) throughout 2 weeks of high-intensity interval training.
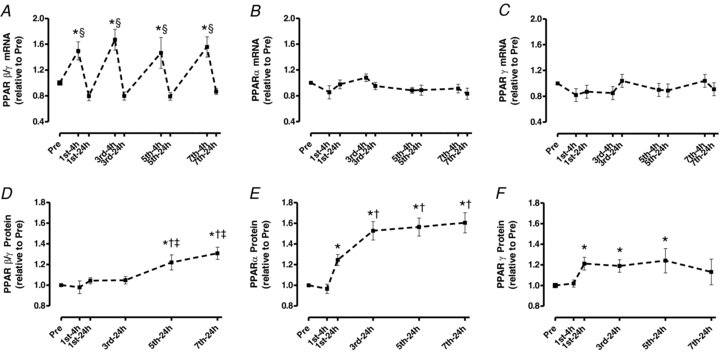
Values are means ±s.e.m. for 8–9 subjects. *Significantly different from Pre, §significantly different from all 24 h time points, †significantly different from 1st-24 h, ‡significantly different from 3rd-24 h (P < 0.05).