
Figure 5. Representative blots (A) and group data for CREB (S133) phosphorylation (B), MyoD (C) and calpastatin (D) mRNA expression, calpastatin protein levels (E), PGC-1α mRNA expression (F), and PGC-1α protein levels (G) in TA muscle of mice after 1, 7 or 28 days of treatment with either saline or formoterol.
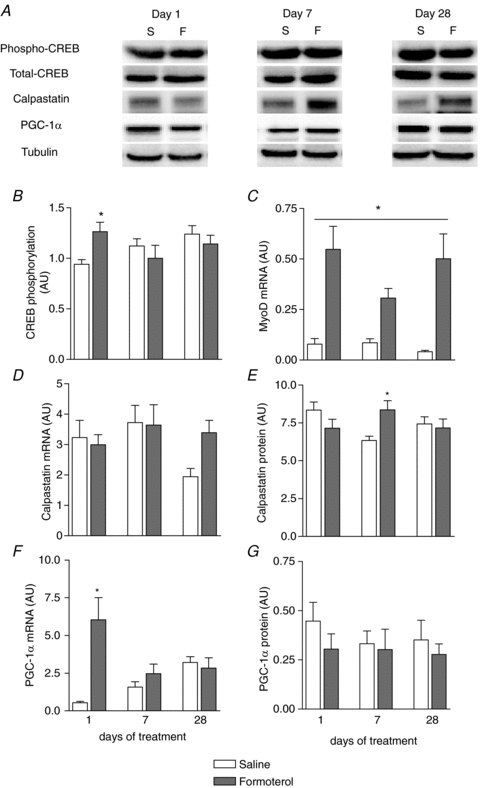
Data are means ±s.e.m.; n= 9. *P < 0.05 versus saline at same time point. #P < 0.05 treatment main effect.