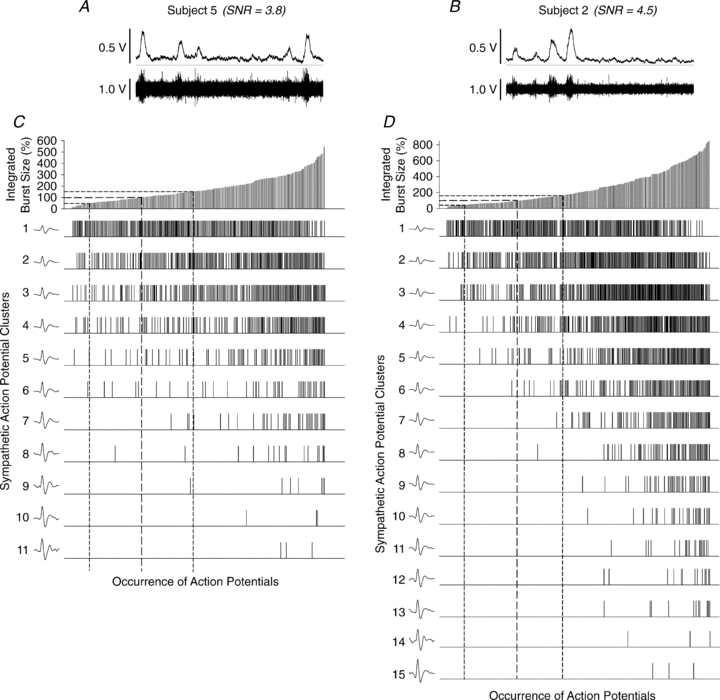
Figure 3. Examples of data obtained from a subject with a low (A and C) and a subject with a high (B and D) signal-to-noise ratio.

A and D illustrate 10 s of the integrated and raw neurograms obtained at baseline from either subject. C and D illustrate the pattern of action potential occurrence as a function of sympathetic burst size and cluster amplitude, for either subject. Range of integrated sympathetic bursts ordered by burst size as a percentage of baseline (C and D, top panels). Dashed lines represent the means and standard deviations of integrated burst sizes at baseline. The occurrences of postganglionic sympathetic action potentials as a function of integrated burst size are indicated for each action potential cluster below. Dashed drop lines indicate range corresponding to baseline bursts. In both subjects, clusters of larger amplitude are predominately recruited at higher levels of sympathetic activation (as determined by integrated burst size).
