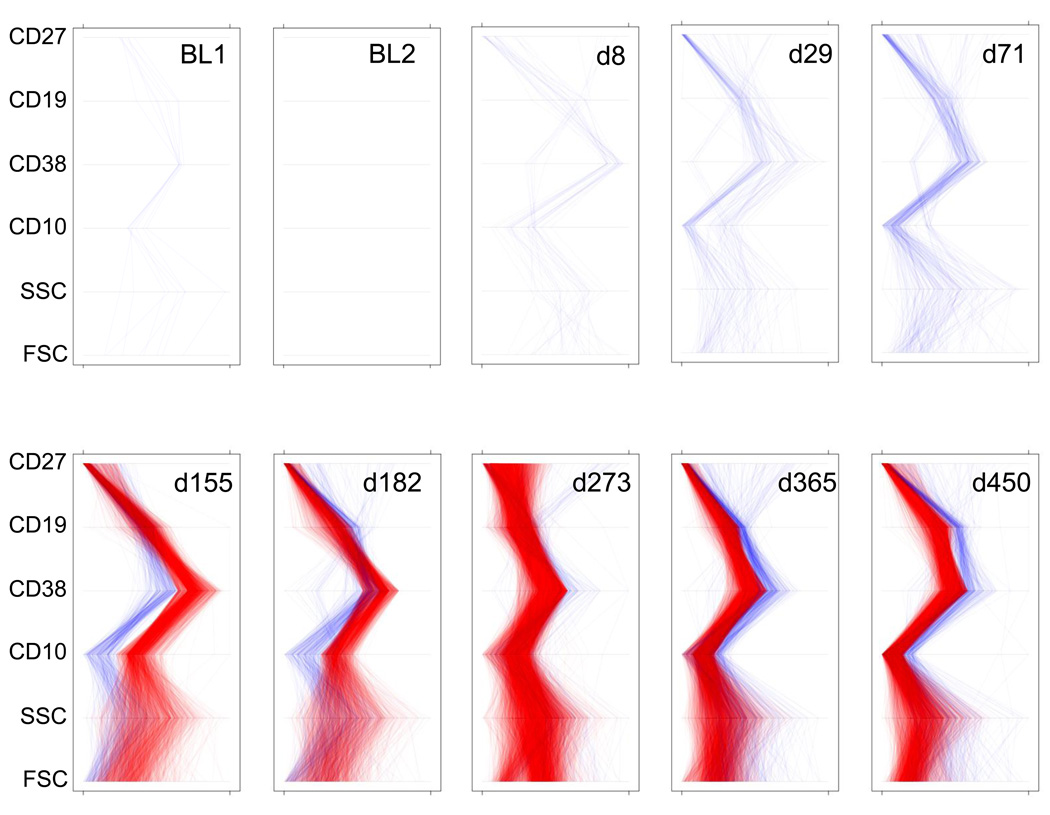
Fig. 5. Parallel Coordinate Plots.
Each panel represents a summary of phenotypic changes at a given time point relative to the aggregated baseline. Each line, from bottom to top of an individual panel, corresponds to a single B cell. Lines are generated by connecting the parameter values for each cell. Red lines indicate cells in bins that are increased by at least 4-fold relative to baseline. Blue lines indicate cells in bins that are decreased at least 4-fold relative to baseline. The y-axis gives the six parameters (FSC, SSC, CD10, CD38, CD19 and CD27). The x-axis for each of the parameters is scaled from the minimum to the maximum observed values for that parameter. BL = baseline. FSC = forward scatter. SSC = side scatter.

