
Table 4.
Ki Values of Nicotinamidase Inhibitors (µM)
 | ||||||
|---|---|---|---|---|---|---|
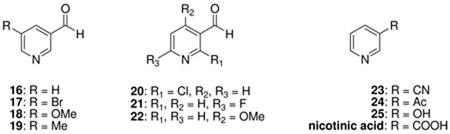
| Substrate | BbNica | PfNicb | Pnc1c | SpNicd | CePNC1e | CePNC2f |
| 16 g | 0.11± 0.02 | 0.034± 0.007 | 1.4± 0.1 | 0.011± 0.001 | 0.11± 0.01 | 0.022± 0.004 |
| 17 g | 1.3± 0.20 | 0.59±0.14 | 4.0± 0.80 | 0.071± 0.022 | 0.14± 0.02 | 0.088± 0.02 |
| 18 g | 0.85± 0.04 | 0.039± 0.004 | 3.8± 0.54 | 0.14± 0.02 | 0.31± 0.05 | 0.14± 0.02 |
| 19 g | 0.19± 0.03 | 0.023± 0.005 | 0.65± 0.07 | 0.056± 0.002 | NDh | ND |
| 20 | 370i | NIj | 5000i | 110i | ND | ND |
| 21 | 18i | 4.9i | NI | 0.73± 0.29g | ND | ND |
| 22 | 153i | 1.0± 0.11 | 68i | 50i | 5.3± 1.0g | 0.44± 0.022g |
| 23 | 2000i | 1000i | 85i | 500i | ND | ND |
| 24 | 342i | 10i | 46i | 60i | ND | ND |
| 25 | NI | NI | NI | NI | ND | ND |
| nicotinic acid | NI | NI | NI | 2000i | NI | NI |
Typical enzyme concentrations: a[BbNic] = 140 nM.
[PfNic] = 14 nM.
[Pnc1] = 210 nM.
[SpNic] = 12 nM.
[CePNC1] = 10 nM.
[CePNC2] = 133 nM. In most cases the inhibitions were determined by the GDH assay as described in Materials and Methods.
The inhibition data was fit to Morrison’s equation 2 described in the Materials and Methods (See examples of data and fits in Figure 6 and in the Supporting Information). The determined Kiapp values were converted to the Ki values (the intrinsic binding constant of the inhibitor for the enzyme) shown in Table 4 by Equation 3 in the Materials and Methods.
ND= not determined.
The inhibition data were fit to Equation 1 as described in Materials and Methods.
NI = no inhibition detected.