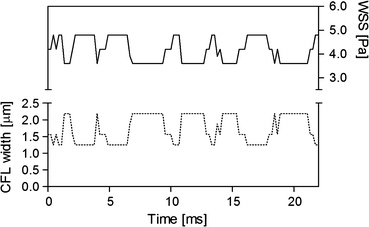
Figure 1.

Relationship between the cell-free layer (CFL) width and wall shear stress (WSS). The solid and dotted lines represent the WSS and CFL width obtained in an arteriole (50 μm ID), respectively. Only 100 data selected from 4500 frames are shown here
