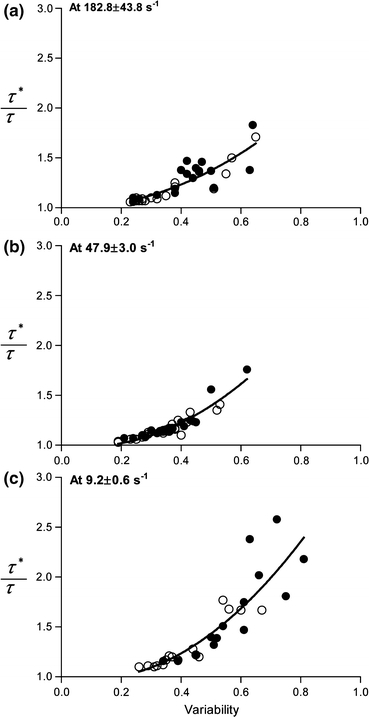
Figure 4.

Ratio between estimated WSS values with (τ*) and without (τ) consideration of variations in the cell-free layer width as a function of the layer variability. The nonlinear regression was performed with a quadratic function (y = B 0 + B 1 x + B 2 x 2, where B 0 is 1) for the combined group (before (○) and after (●) dextran treatment). y = 1 − 0.07x + 1.64x 2; R 2 = 0.76 at 182.8 ± 43.8 s−1. y = 1 − 0.36x + 2.31x 2; R 2 = 0.88 at 47.9 ± 3.0 s−1. y = 1 − 0.52x + 2.77x 2; R 2 = 0.77 at 9.2 ± 0.6 s−1
