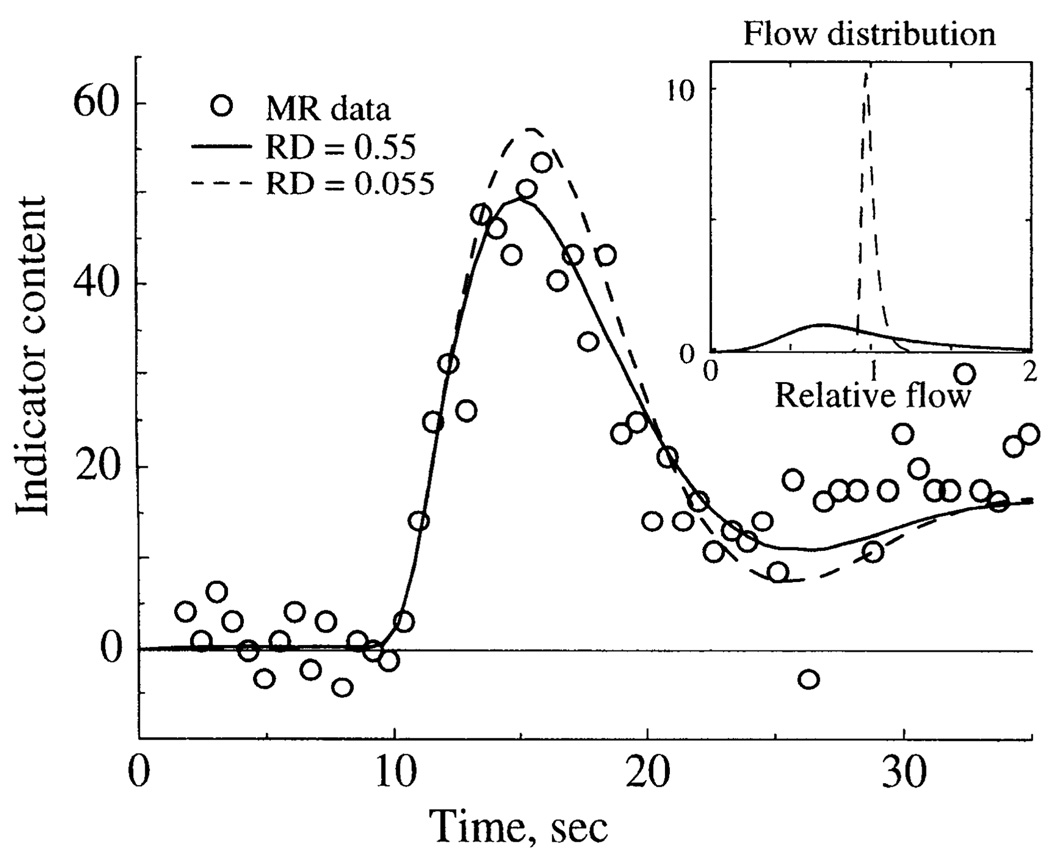
Fig. 7.
Effect of flow heterogeneity on model fit to MR content-time curve. Inset: distribution of relative flows used to model normal [relative dispersion (RD) = 0.55] and decreased (RD = 0.055) flow heterogeneity. MR data and model solutions are shown with normal and decreased heterogeneity, with other parameters kept constant.

