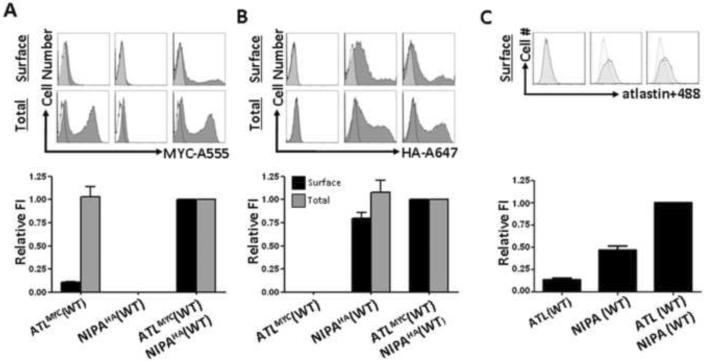
Figure 4. The presence of NIPA1 facilitated trafficking of atlastin-1 to the cell surface.
Representative flow cytometry frequency histograms of Alexa-555 (A555) fluorescence intensity for cells expressing atlastin-1-myc (A, upper row), Alexa-647 (A647) fluorescence intensity for cells expressing NIPA1-HA (B, upper row), and atlastin-1 antibodies with Alexa-488 secondary antibodies (panel C, upper row). A representative histogram from mock transfected cells (white) was overlaid on each of the histograms from positively transfected cells (grey). The x-axis indicates arbitrary fluorescence units (log scale) and the y-axis indicates the number of cells.
Lower row shows plotting of the surface and total expression of tagged atlastin-1 (panel A), NIPA1 (panel B) and atlastin-1 antibodies (panel C) on the cell surface. Surface staining (without membrane permeabilization) is depicted by black columns and total cellular staining (after membrane permeabilization) is depicted as gray columns. Co-transfection of atlastin-1-myc and NIPA1-HA resulted in approximately 10-fold increase of cell surface activity without changing the total amount of expressed atlastin-1. Same pattern was observed when we used direct atlastin-1 antibodies (panel C).

