
Figure 5.
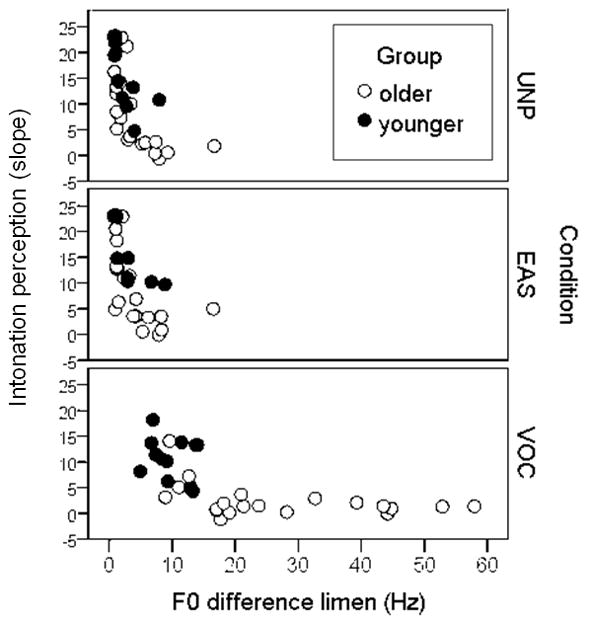
The slope of the intonation function is plotted as a function of F0DL. Each data point represents a single subject. For intonation, greater slopes indicate better perception of intonation. For F0DL, smaller numbers indicate better perception of F0 differences.