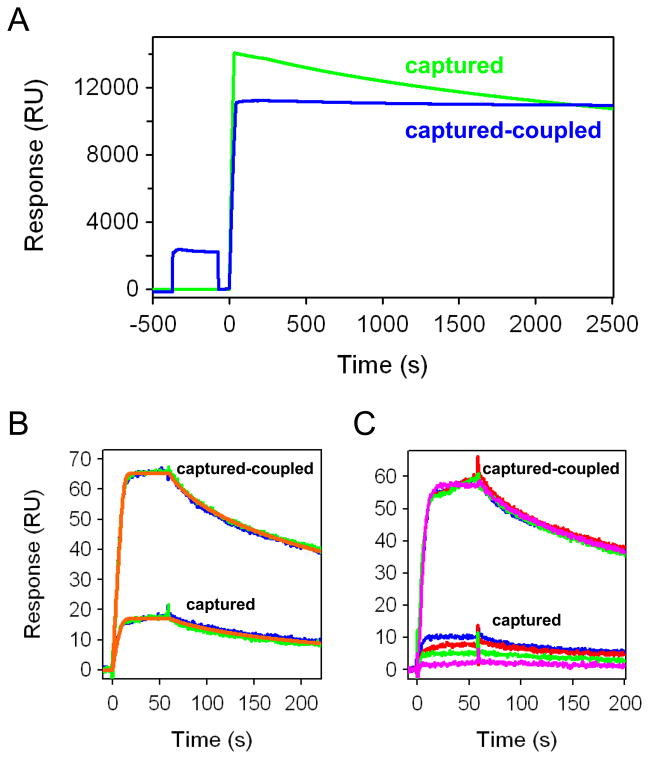
Figure 1.
NTA capture methods of His-tagged GPCRs. (A) Sensorgrams for direct capture (green) and capture-couple (blue) of His-tagged β1AR*. (B) Blue and green traces represent duplicate responses for 500 nM propranolol binding to directly captured and captured-coupled β1AR*. The first propranolol injection over both surfaces is shown in blue, the second in green. The red lines depict the fit of a 1:1 interaction model to each data set. (C) Replicate responses for 500 nM propranolol tested over 28 hours (sample order was blue, red, green, then pink) for binding to the captured-coupled and captured β1AR* surfaces.

