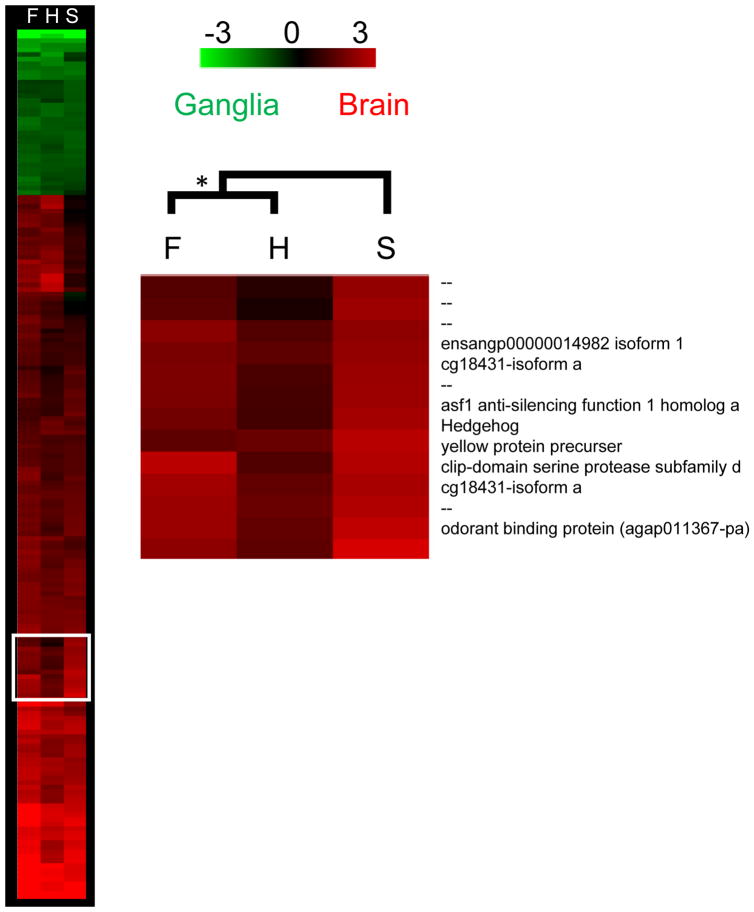
Figure 3. Brain Arrays for O. taurus.
Shown are the results of a clustering analysis for the brain-ganglia arrays for O. taurus large, horned males (H), small, sneaker males (S) and females (F). Genes included in the analysis were significantly differentially expressed (P < 0.05) at least two-fold between tissues (|M| >1) in at least one treatment category (H, S, or F). We identified one cluster of genes with biased expression in the developing brain of sneaker males. Bootstrapping is 100%.

