
Figure 7. Histologic analysis of biopsy sites.
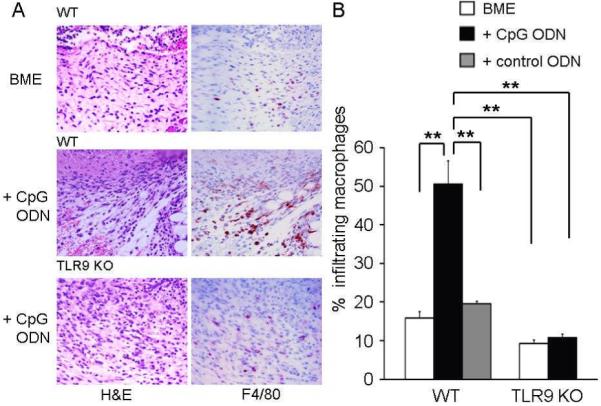
Histologic sections were obtained from biopsy sites as described in Fig 3. (A) Photomicrographs from representative wild type mice (upper and middle panels) and TLR9 KO mice (lower panel, original magnification 400X) stained with H & E (left side) or anti-F4/80 (right side). (B) Macrophages as a percentage of the total number of infiltrating cells (mean + SE) from 3 independent experiments involving 3-4 animals/group.
**; p < 0.01