Figure 3.

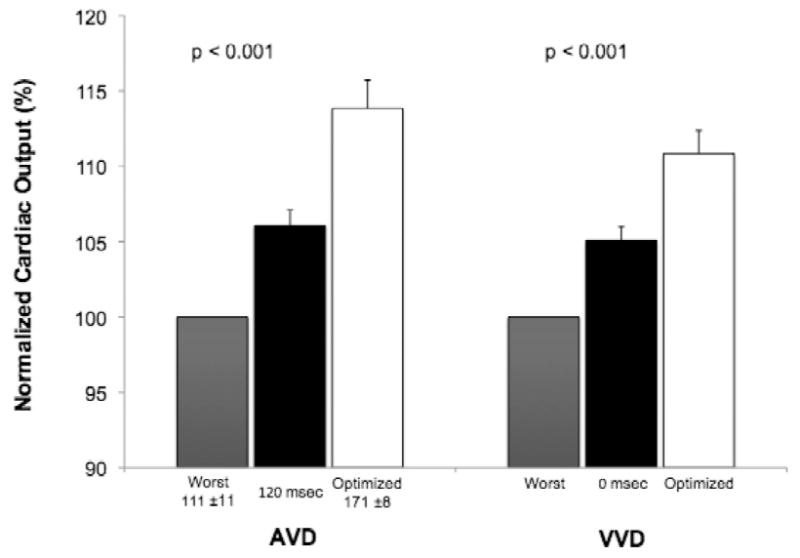
BiVP optimization profiles for AVD and VVD. Mean COs are normalized to a scale of 100, with the worst parameter as the reference group. Error bars depict one standard error of the mean.

BiVP optimization profiles for AVD and VVD. Mean COs are normalized to a scale of 100, with the worst parameter as the reference group. Error bars depict one standard error of the mean.