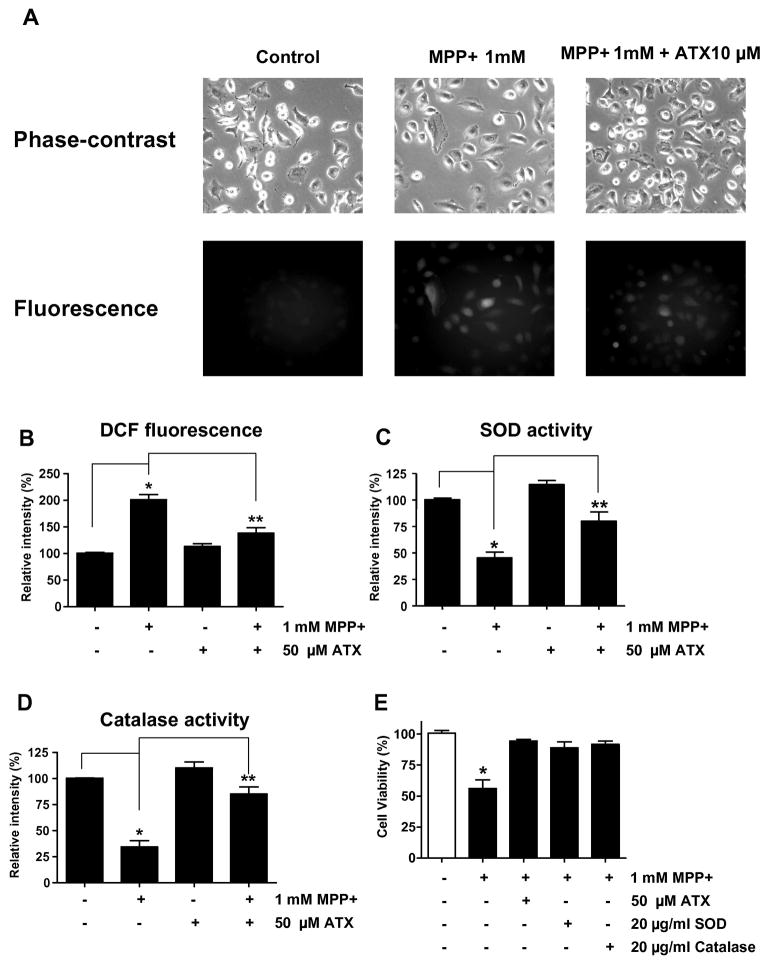
Fig. 3.
Effect of AST on MPP+-mediated ROS generation in SH-SY5Y cells. (A) and (B) Cells were treated with 1 mM MPP+ in the absence or presence of 50 μM AST for 24 h as described in Fig. 2B. After treatment, ROS generation was determined with 5 μM CMH2DCFDA. Morphological features were analyzed with a phase-contrast microscope and fluorescent signals were detected with fluorescence microscopy (A). DCF fluorescence intensity was determined and plotted (B). (C) and (D) Cells were treated with 1 mM MPP+ in the absence or presence of 50 μM AST for 24 h as described in Fig. 2B. After treatment, SOD activity (C) and catalase activity (D) were measured. (E) Cells were treated with 1 mM MPP+ in the presence/absence of 50 μM AST, 20 μg/ml SOD, or 20 μ/ml catalase for 24 h. Data are expressed as percentage of values in untreated control cultures, and are means ± S.E.M. (n = 4). *p < 0.05, compared with control (untreated group); **p < 0.01, compared with the group treated by MPP+ alone.

