
Figure 2.
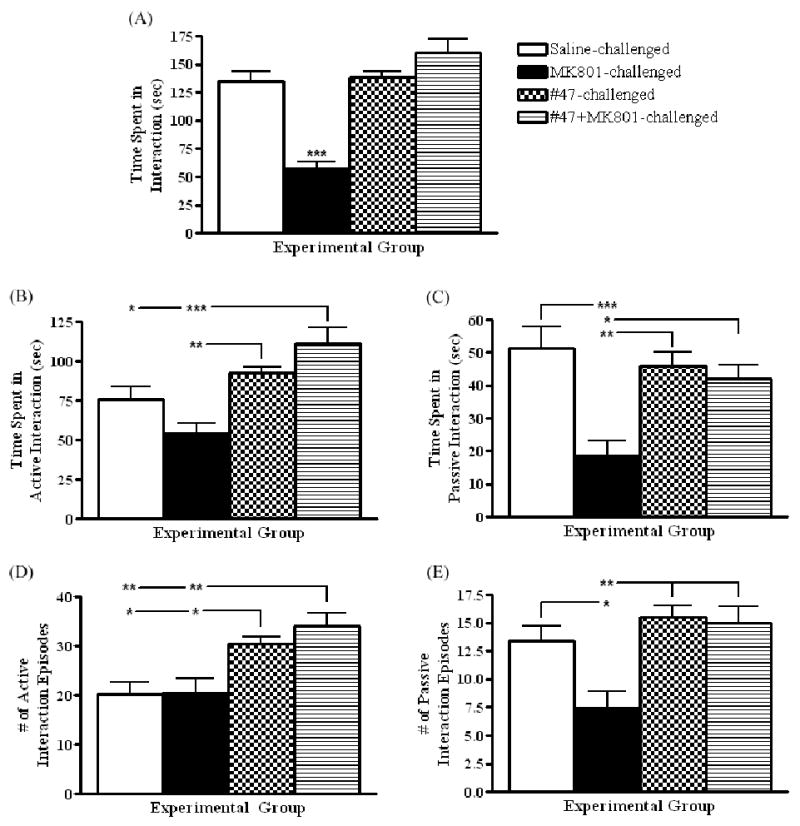
Graphs depicting social behaviour (mean ± SEM) in saline-, MK-801-, MK-801+PAOPA (#47)-, and PAOPA (#47)-injected animals after 7 days of drug challenge. (A) Total time spent in interaction: F(3,26) = 21.92, ***p < 0.0001; (B) time spent in active interaction: F(3,27) = 10.29, ***p 0.0001; (C) time spent in passive interaction: F(3,25) = 8.464, ***p < 0.004; (D) number of active interaction episodes: F(3,28) = 8.621, ***p = 0.0003; and (E) number of passive interaction episodes: F(3,26) = 7.648, *** p = 0.009. Post-hoc: *p < 0.05, **p < 0.01, ***p < 0.001. N=10/group.