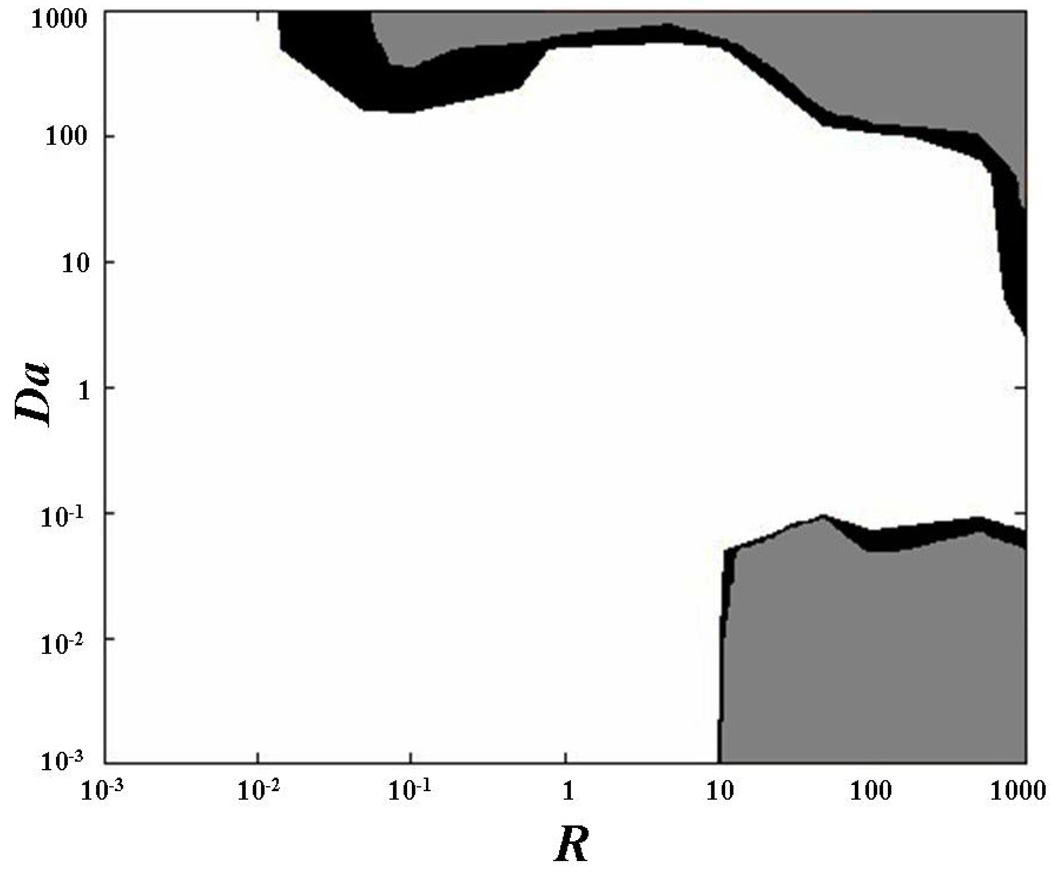
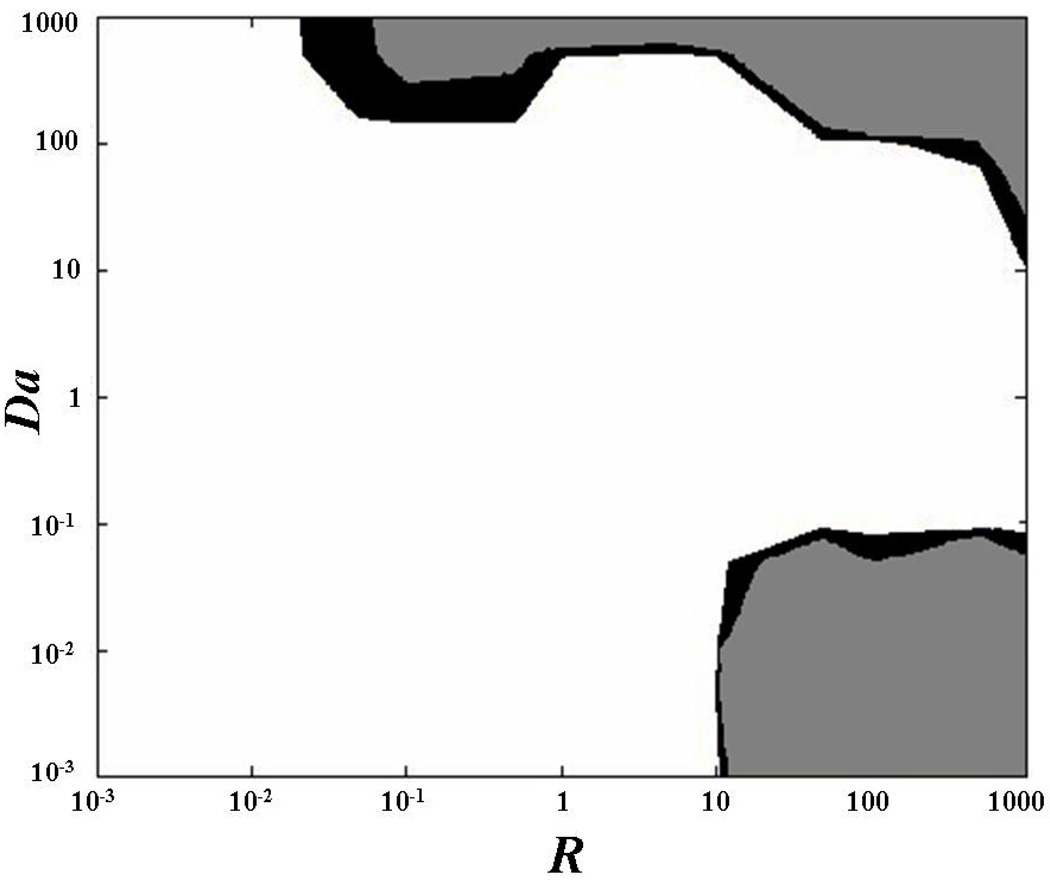
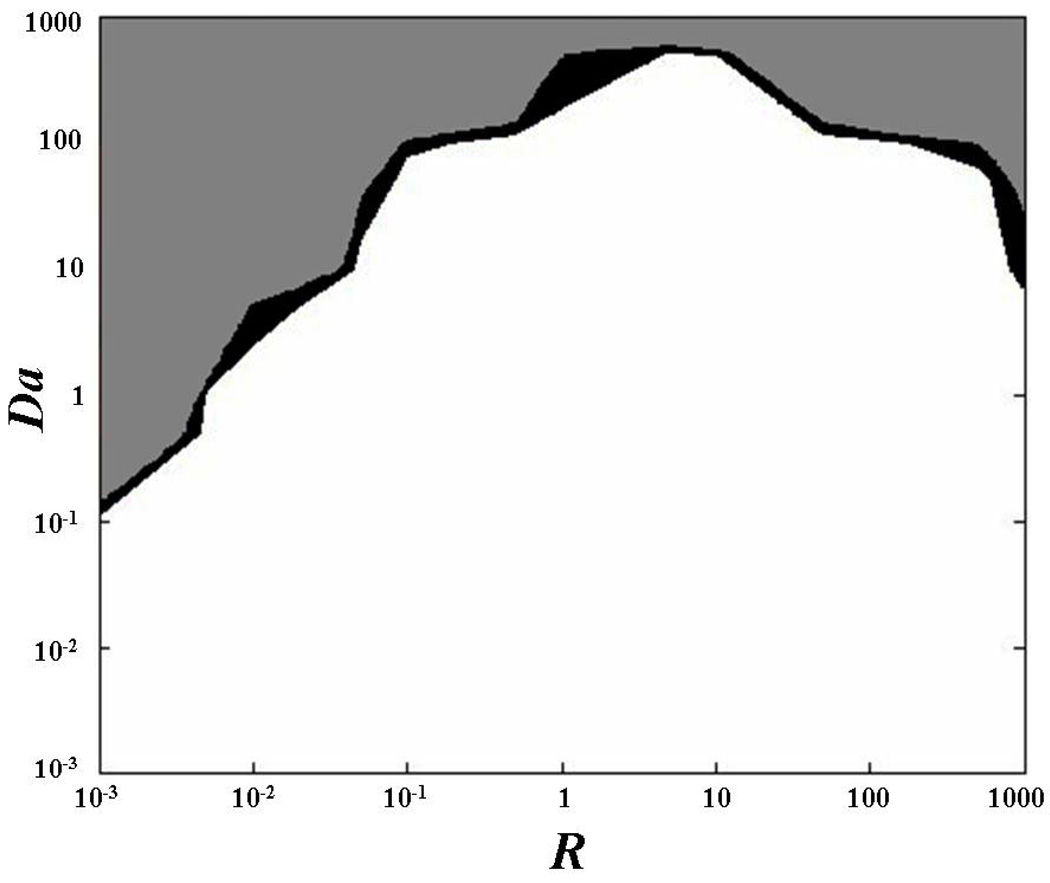
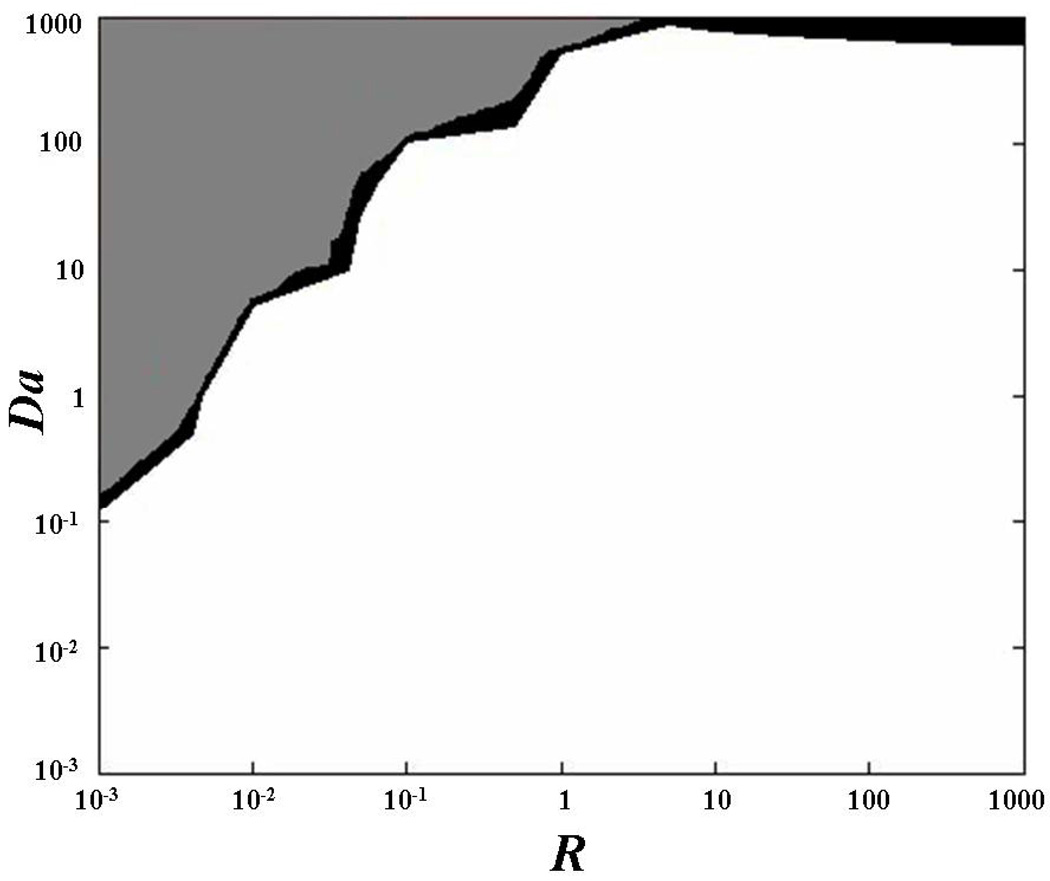
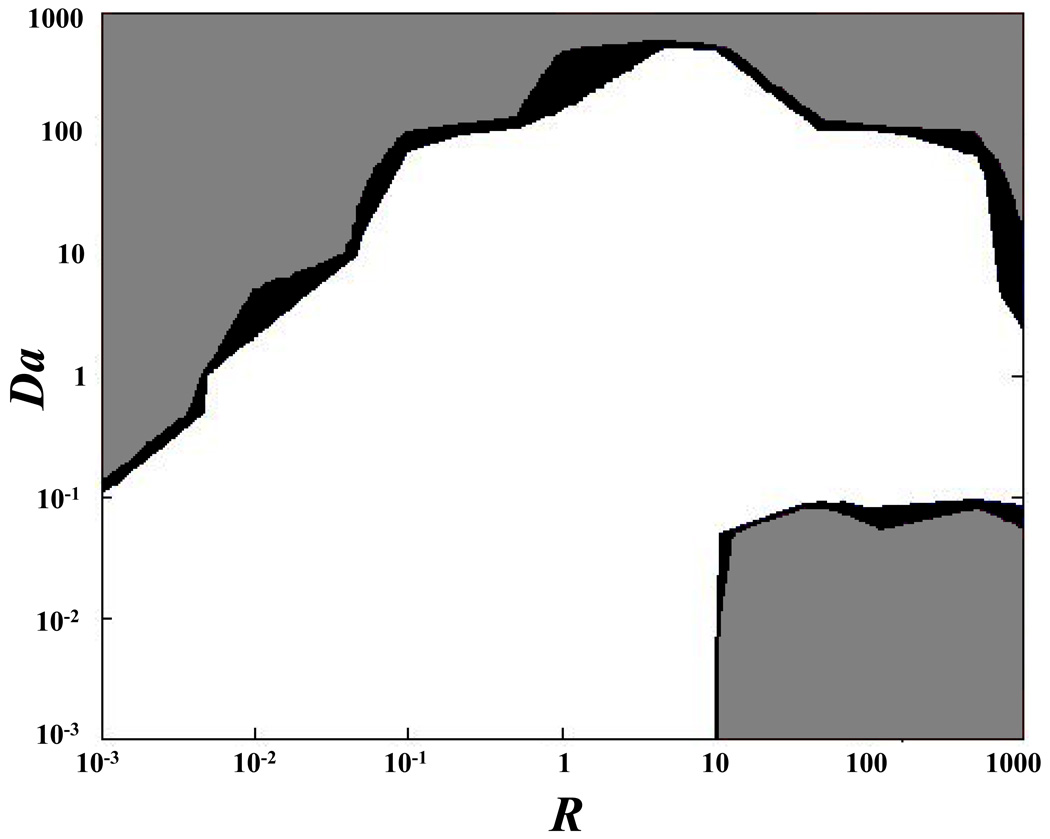
Figure 5.
Determination of anisotropic diffusive-reactive parameters at various diffusive-reactive transport regimes. The areas of the contour plots indicate values of the relative error (ε) less than 2% (white), between 2 and 5% (black), and more than 5% (gray). (a) Determination of D’xx. (b) Determination of D’yy. (c) Determination of k*a. (d) Determination of kd. (e) Overlay of relative errors in determining all the diffusive-reactive parameters. For all the cases reported in this figure, tr(D) = 10−6 cm2s−1, and D’xx/D’yy = 2.

