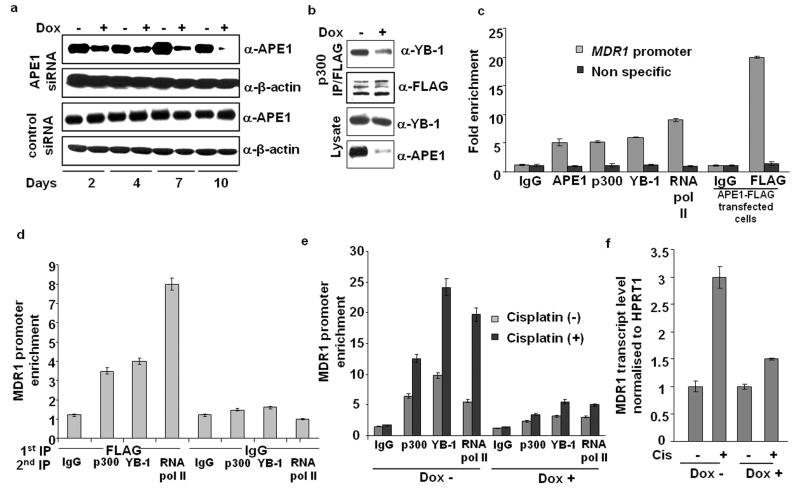
Figure 2.
Requirement of APE1 in YB-1/p300 recruitment and RNA pol II loading on MDR1 promoter. (a) HEK-293T cells expressing APE1 siRNA (APE1siRNAHEK-293T cells) or control duplex siRNA (ControlsiRNAHEK-293T cells) under a Doxycycline (Dox)-inducible promoter were established following the procedure described in Materials & Methods. These cells were treated with Dox (1ug/ml) for the indicated times and APE1 levels were measured by Western analysis; β-actin antibody was used as a loading control. (b) APE1siRNAHEK-293T cells were treated with (+) or without (-) Dox for 8 days and then the cells were transfected with p300-FLAG expression plasmid. Nuclear extracts were immunoprecipitated with FLAG antibody and Western analysis of the IPs was performed with YB-1 or FLAG antibody; YB-1 and APE1 levels in the lysates (lower panels). (c) CHIP assay in HEK-293T cells or APE1-FLAG transfected HEK-293T cells with the indicated antibodies. Immunoprecipitated Y-box element containing MDR1 promoter sequence or a non specific coding sequence in the MDR1 gene distant to Y-box element was amplified and quantified by SYBR GREEN based Real Time PCR analysis. Values in the bar diagram are relative to PCR from input chromatin. (d) re-ChIP assay of immunoprecipitated APE1-FLAG bound chromatin from APE1 FLAG transfected HEK-293T cells with p300, YB-1 or RNA pol II Ab or control IgG. The first IP was carried out with FLAG antibody or control IgG and the second IP was carried out with p300, YB-1 or RNA pol II Antibody or control IgG. (e) APE1 levels in APE1siRNAHEK-293T cells were downregulated with Dox treatment. Then the cells were treated with (+) or without (-) cisplatin for 1 hour, and 5 hours later, ChIP assay was carried out with p300, YB-1 or RNA pol II Antibody or control IgG. (f) Real Time RT-PCR analysis of MDR1 transcript. APE1 levels in APE1siRNAHEK-293T cells were downregulated with Dox treatment. The cells were then treated with cisplatin for 1 hour and 16 hours later total RNA was isolated and subjected to cDNA synthesis and Real Time PCR. Values in the bar diagram (normalized with respect to HPRT1 transcript) are relative to cisplatin untreated control. All the results represent the mean ± standard deviations of 3 independent experiments performed in duplicates.

