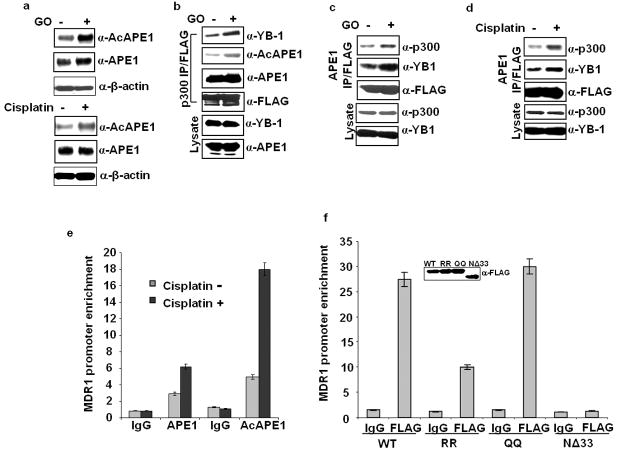
Figure 3.
Oxidative stress enhances APE1’s acetylation and its association with YB-1/p300 on MDR1 promoter. (a) HEK 293T cells were treated with 100 ng/ml of Glucose oxidase (GO) or 40 μg/ml of cisplatin for 1 hour, and 5 hours later the AcAPE1, APE1 or β-actin levels in the whole cell extracts were measured by Western analysis. (b) HEK-293T cells transfected with FLAG-tagged p300 were treated with GO (100 ng/ml) for 1 hour, and 5 hours later, nuclear lysates were prepared and immunoprecipitated with FLAG antibody. Western analysis of the IPs with YB-1, AcAPE1, APE1 or FLAG antibody; YB-1 and APE1 levels in the lysates (lower panels). (c & d) HEK-293T cells transfected with FLAG-tagged APE1 were treated with GO (100 ng/ml) or cisplatin (40 μg/ml) as above, nuclear lysates were prepared and immunoprecipitated with FLAG antibody. Western analysis of the IPs with p300, YB-1 or FLAG antibody; p300 and YB-1 levels in the lysates (lower panels). (e) ChIP assay for the association of AcAPE1 on MDR1 promoter. HEK-293T cells were treated with cisplatin as above and ChIP assay was performed with APE1 or AcAPE1 antibody or control IgG. (f) HEK-293T cells were transfected with WT APE1, RR, QQ or NΔ33 APE1 and ChIP assay was carried out with FLAG antibody or control IgG. Inset panel shows the level of FLAG tagged WT or mutant APE1 proteins in the cell extracts determined by Western analysis with FLAG antibody. Values in the bar diagram in all the cases are relative to PCR from input chromatin and results represent mean ± standard deviations of 3 independent ChIP experiments performed in duplicates.

