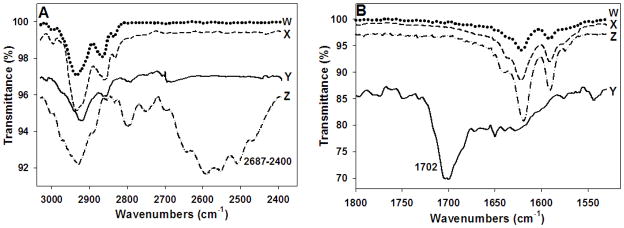
Figure 4.
IR spectra for the QN-heme adduct (W, dotted line), QN free base (X, dashed line), hematin (Y, continuous line), and QN hydrochloride salt (Z, dash-dot line). A) The broad peak at 2687-2400cm−1 in the QN hydrochloride spectrum that corresponds to the N-H stretch of the protonated quinuclidyl nitrogen is absent in the QN free base, heme, and the QN-FPIX adduct spectra; B) the strong peak at 1702 cm−1 in the heme spectrum that corresponds to the carbonyl stretch of the heme carboxylic acids is absent in the QN free base, QN hydrochloride, and QN-FPIX adduct spectra.

