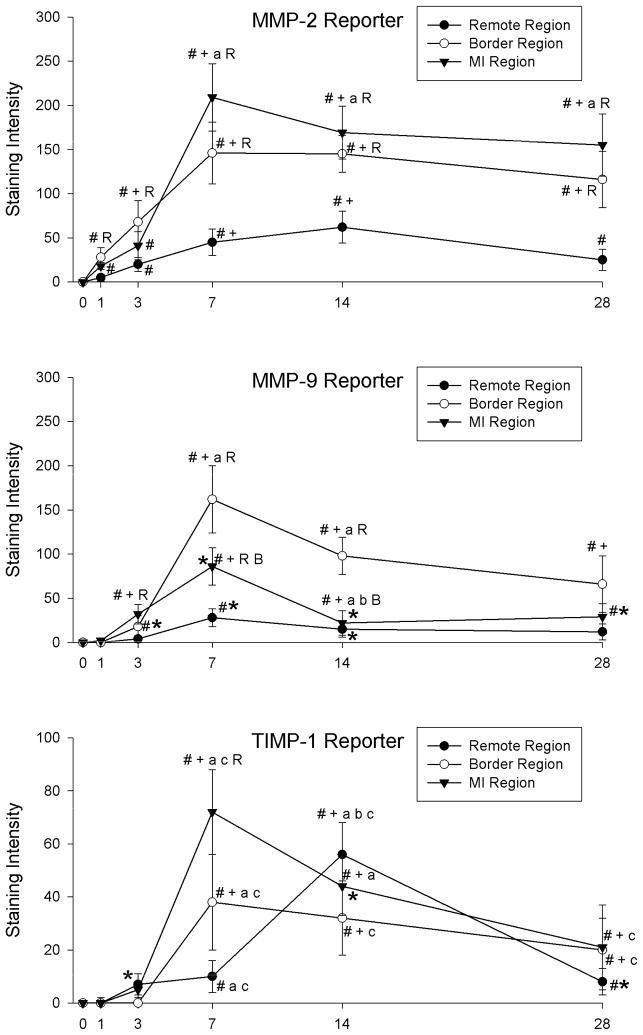
Figure 3.
Spatial distribution of β-galactosidase staining intensity following MI in the remote, border, and MI regions of LVs from MMP-2 (TOP), MMP-9 (MIDDLE), and TIMP-1 (BOTTOM) reporter lines. MMP-2 promoter activation peaked in the MI region at 7 days post-MI and MMP-9 promoter activation was highest in the border region at 7 and 14 days post-MI. TIMP-1 promoter activation peaked within the MI region at 7 days post-MI and within the remote region at 14 days post-MI. Please note different y-axis scale for TIMP-1 reporter graph. # p<0.05 vs. Acute (1 hour post-MI), + p<0.05 vs. 1 day post-MI, a p<0.05 vs. 3 days post-MI, b p<0.05 vs. 7 days post-MI, R p<0.05 vs. strain-matched remote region, B p<0.05 vs. strain-matched border region, *p<0.05 vs. MMP-2 Reporter values only, c p<0.05 vs. MMP-2 and MMP-9 Reporter values.

