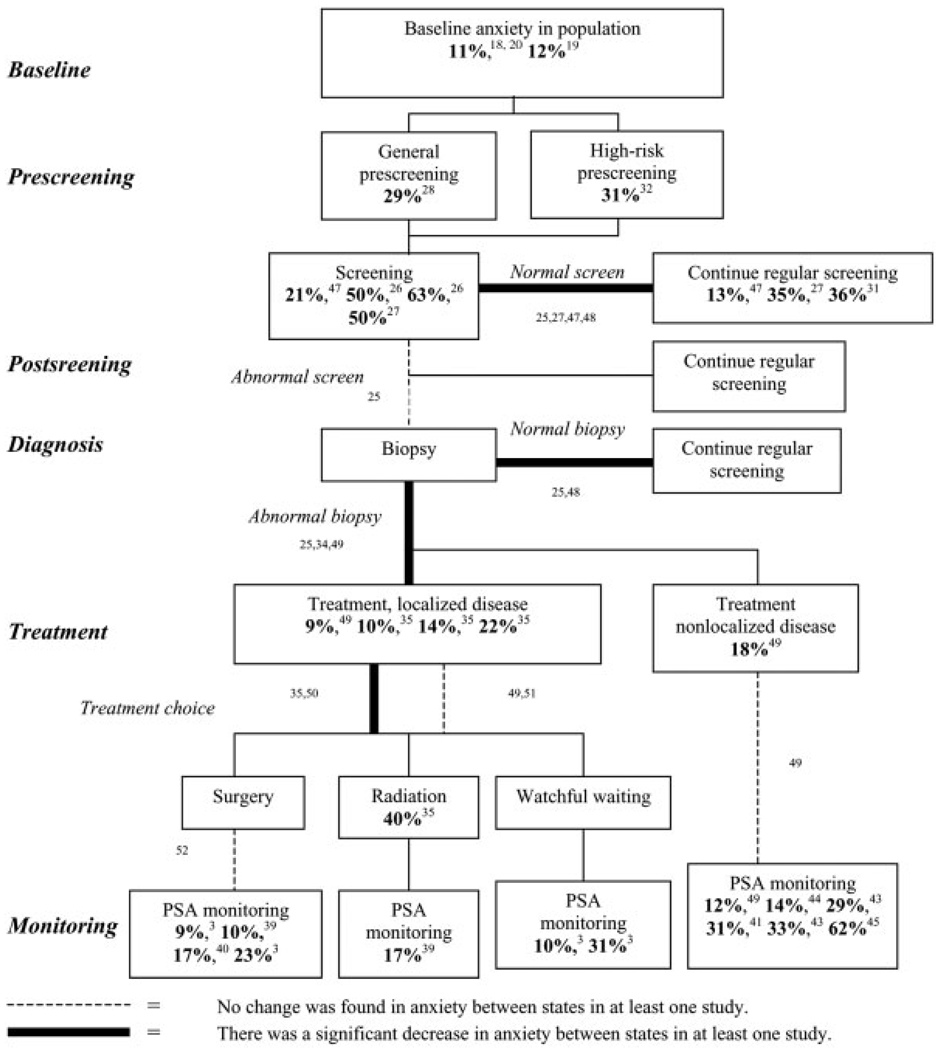
FIGURE 1.
This chart illustrates the timeline of anxiety in prostate carcinoma and summarizes findings from the literature using standardized anxiety measures. Text boxes represent relevant patient populations at selected times in the potential course of screening, diagnosis, treatment, and follow-up. Cross-sectional studies of population anxiety levels are reported in these boxes. Lines connecting boxes represent transition points between populations when anxiety levels may change, and longitudinal studies that assessed changes in a population over time provided evidence for these relations. Finally, italicized text represents important decision-making points, such as screening tests, biopsy results, and treatment choices. Except for “Baseline,” details for the reported percentages are included in Table 3, including the anxiety measurement scales used and the definitions of cut-off values for determining a “case” of anxiety. For details on longitudinal changes in anxiety levels across populations, see Table 4 for studies and measurement instruments. Superscript numerals indicate references. PSA: prostate-specific antigen.

