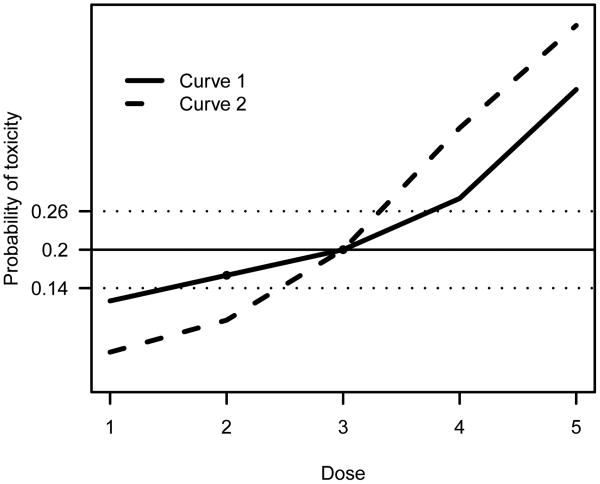
Fig 1.
Two dose-toxicity curves under which dose 3 is the MTD with p = .20. A δ-sensitive design with δ = .06 will eventually select doses 2 or 3 under the shallow curve (Curve 1), but will be consistent for dose 3 under the steep curve (Curve 2). The horizontal dotted lines indicate the indifference interval.

