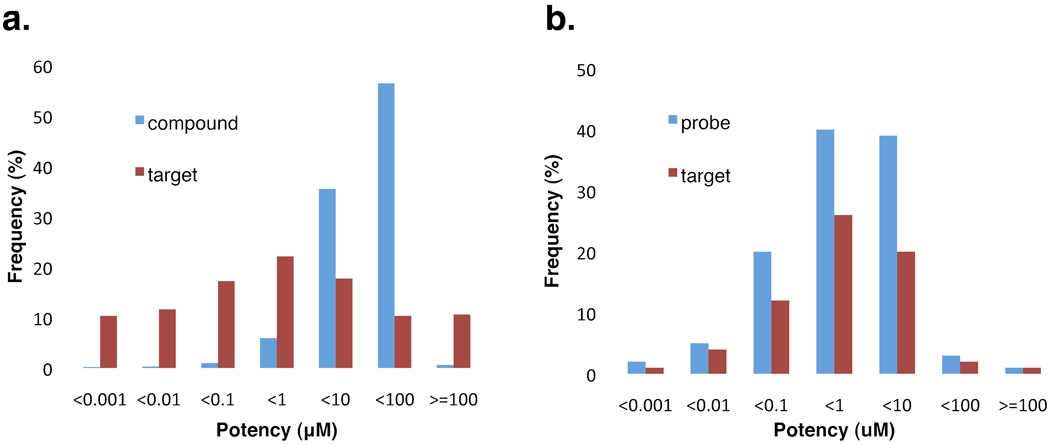
Figure 2.
The distribution of the potency of the bioactive compounds and protein targets in PubChem. a. blue bars show the distribution of the potency for entire bioactive compounds in PubChem in seven potency groups; red bars denote the frequency of the protein targets with most potent compounds falling in respective potency group. b. blue bars represent the distribution of potency for chemical probes indentified by the NIH Molecular Libraries Program (MLP); red bars show the frequency of the protein targets with most potent chemical probes falling in respective potency group.

