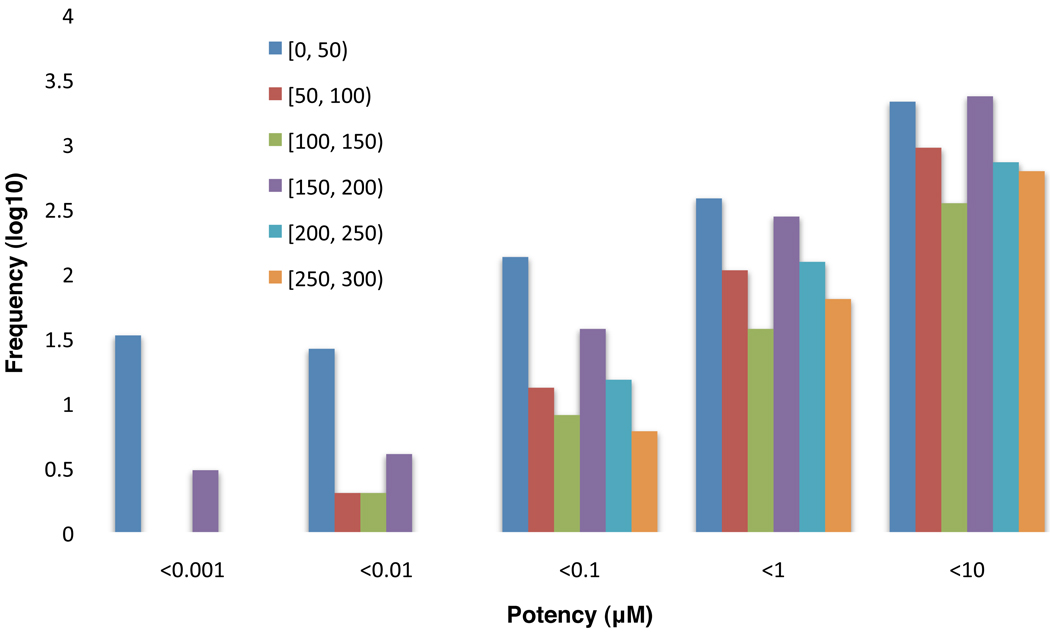
Figure 4.
The distribution of the selective compounds in PubChem. X-axis represents the potency in micromole; Y-axis represents the frequency in the scale of log10. The colour of the bars denotes the ranges of how many targets against which the selective compounds were tested. For example, the range of [100,150) means that this group of compounds were tested against 100 to 150 targets and selectively against one of them.

