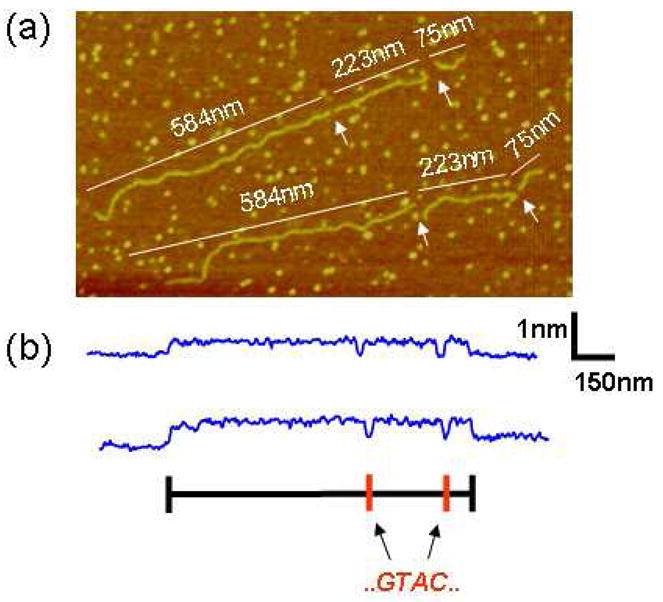
Figure 6.

(a) Image of two pUC19 molecules on treated mica (10 mM NiCl2), after in situ digestion with restriction enzyme RsaI (recognition sequence GATC). White arrows indicate gaps corresponding to the location of GTAC sequences within the DNA molecule. Fragment lengths (nm) are indicated on image. (b) Corresponding height profile plots taken along the backbone contour of each molecule.
