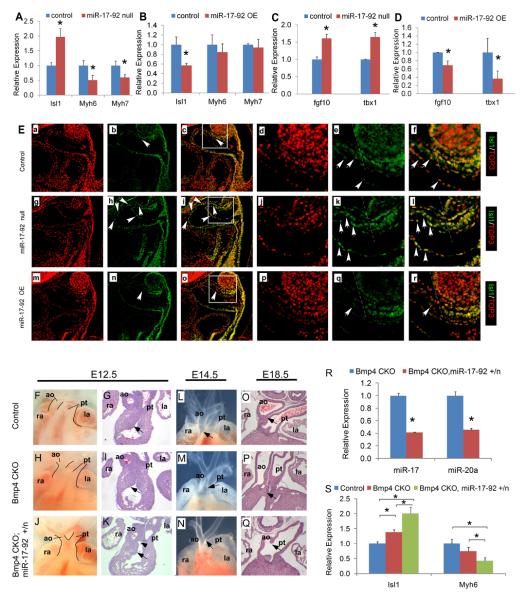
Figure 3. MiR-17-92 cardiac phenotype and Bmp4 genetic interaction.
(A-D) Real time qPCR analysis. *, statistically significant difference (P < 0.05). (E) Immunofluorescence at E9.5. Boxed areas in c, i, o are correspondingly shown at higher magnification in d-f, j-l and p-r. Tangent line with branchial arch landmark (dashed line), reveals Isl1-expressing progenitors toward proximal OFT (left of dashed line) were persistent in miR-17-92 null mutants (arrows in h, i, k and l) while decreased in controls (arrows in b, c, e and f) and almost extinguished in miR-17-92 OE mutants (arrows in n, o, q and r). Persistent Isl1-expressing progenitors in endocardium of miR-17-92 null mutants (arrowheads in h, i, k and l). ao, aorta; la, left atrium; ra, right atrium; pt, pulmonary trunk. (F-K) Whole mount (F, H, J) and sections (G, I, K) of embryos with the indicated genotypes and stages. Arrows in G, I, K denote the proximal cushion mesenchyme and arrowhead in K the OFT septum. (L-N) E14.5 embryos showing normal and defective OFT alignment (arrows). (O, P, Q) Transverse sections through OFT showing normal and defective separation between the aorta and pulmonary trunk (arrows). (R, S) Real time qPCR analysis. *, (P < 0.05; error bars represent SEM).

