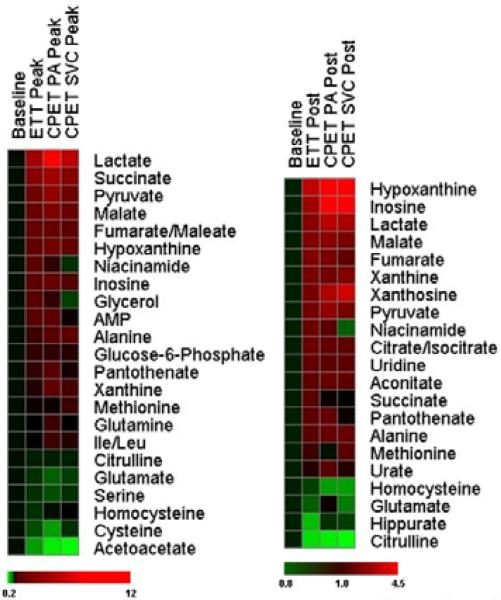
Figure 1. Relative changes in metabolites in response to exercise.
Heatmaps show changes in metabolites compared to baseline at the peak exercise time point (left panel) and at 60 minutes after exercise (right). Shades of red and green represent fold-increase and fold-decrease of a metabolite, respectively, relative to baseline metabolite concentrations (see color scale). Three distinct plasma samples are represented: peripheral plasma from the ETT cohort; pulmonary arterial (PA) plasma from subjects undergoing CPET; and superior vena cava (SVC) plasma from subjects undergoing CPET.

