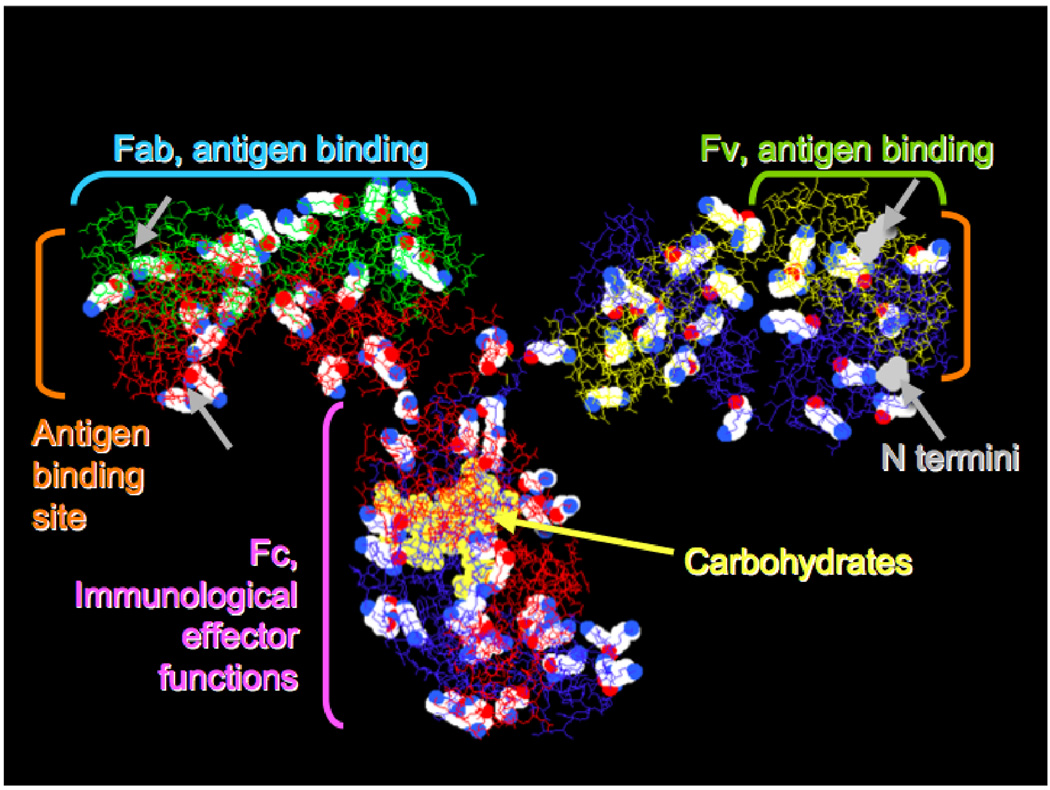
Figure 1.
An example monoclonal antibody structure (pdb 1IGT, mouse IgG2a), showing 82 lysine residues in cpk spacefill, carbohydrates in yellow spacefill, and N-terminal residues in gray spacefill (visible on the right side only). Heavy chains are red and blue; light chains green and yellow. Important functional regions and fragments are also noted with single brackets.

