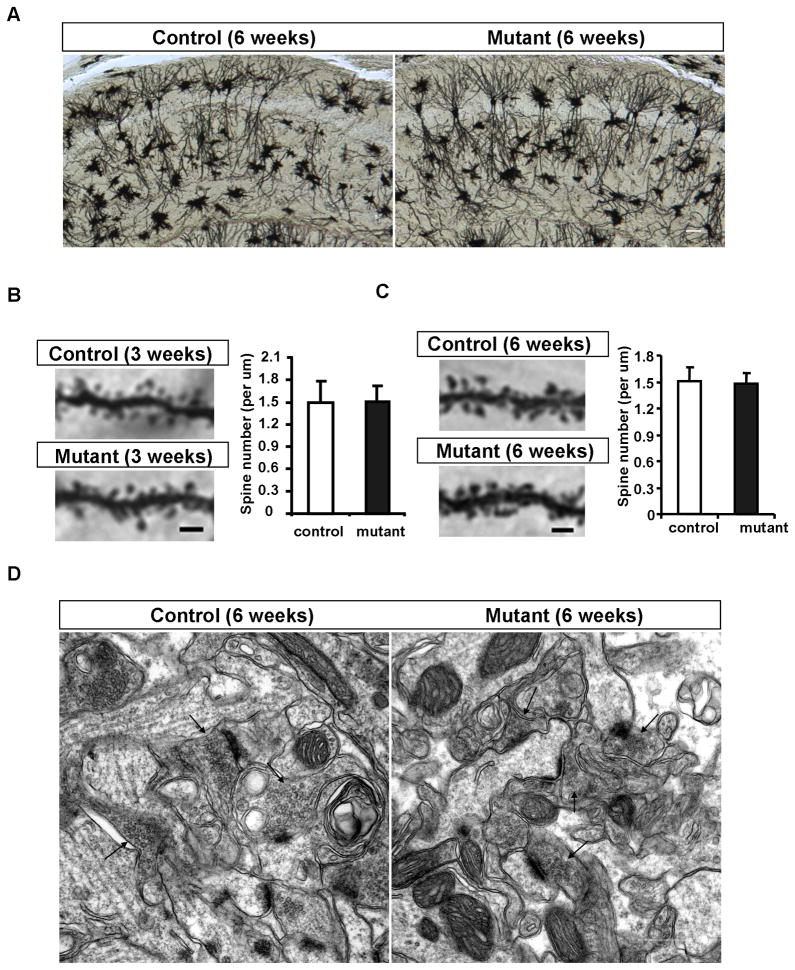
Figure 3. Normal neuronal morphology and synapse ultrastructure of Pik3c3-cKO at the age of 6-week.
A. Representative image of Golgi staining of hippocampal neurons in the CA1 region from 6-week old controls and Pik3c3-cKO mutant mice. Scale bar: 100 μm
B. Representative images of the first order branch of apical dendrites within lucidum-radiatum region from control and Pik3c3-cKO mutant CA1 hippocampal neurons at the age of 3 weeks. Scale bar: 2 μm. Histogram shows the spine density (averaged from 24 randomly selected sections from different mice for each genotype). p>0.9, Two-tailed paired t test.
C. Representative images of the first order branch of apical dendrites within lucidum-radiatum region from control and Pik3c3-cKO mutant CA1 hippocampal neurons at the age of 6 weeks. Scale bar: 2 μm. Histogram shows the spine density (averaged from 24 randomly selected sections from different mice for each genotype). p>0.9, Two-tailed paired t test. D. Representative electron microphotographs of the CA1 region from control and Pik3c3-cKO mice at age of 6 weeks. Scale bar, 0.5 μm.

