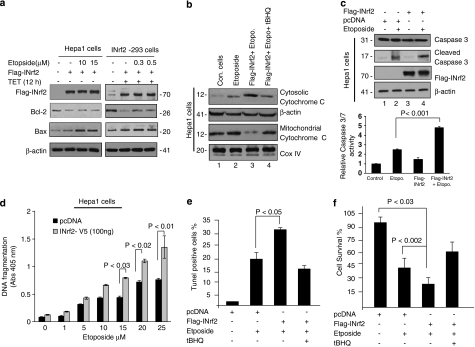
Figure 6.
INrf2 overexpression and etoposide treatments upregulate proapoptotic marker proteins and induce cellular apoptosis. (a) Immunoblot analysis. Hepa-1 cells transfected with Flag-INrf2, or INrf2-293 cells treated with tetracycline were treated with etoposide as indicated and lysates were immunoblotted with antibodies as shown. (b) Immunoblot analysis. Hepa-1 cells were transfected with Flag-INrf2 and treated with etoposide (30 μM) for 48 h or with etoposide plus tBHQ for 48 h. Cells were harvested and mitochondria were isolated using a mitochondria isolation kit (Thermo Scientific, Rockford, IL USA) and 30 μg of mitochondrial and cytosolic lysates was immunoblotted. (c) Immunoblot and activity analysis. Hepa-1 cells were transfected with pcDNA or Flag-INrf2 for 24 h and treated with and without 30 μM etoposide for an additional 48 h. A volume of 60 μg of lysates was immunoblotted with caspase-3 and anti-Flag antibodies. Caspase-3/7 activity was measured from the same lysates using a caspase-3/7 Luminescent Assay Kit, Caspase-Glo(Promega), and plotted (lower panel). (d) DNA fragmentation assay. Hepa-1 cells transfected with pcDNA or INrf2-V5, treated with indicated concentrations of etoposide for 72 h, and cytosolic DNA fragmentations were quantified using a Cell Death Detection ELISA kit (Roche) and plotted. (e) TUNNEL assay. Hepa-1 cells grown on coverslips were transfected with Flag-INrf2, and treated with etoposide (30 μM; 30 h) or etoposide+tBHQ (50 μM) for 24 h. Cells were fixed, permeabilized, and TUNNEL assay was performed. TUNNEL-positive cells were quantified and plotted. (f) Cell survival assay. Hepa-1 cells transfected with Flag-INrf2 were treated with etoposide or etoposide and tBHQ for 72 h, incubated with fresh MTT solution for 2 h and absorbance at 490 nm was measured. All experiments were repeated three times. Data were shown as the mean value±S.D. from three independent experiments

