
Figure 4.
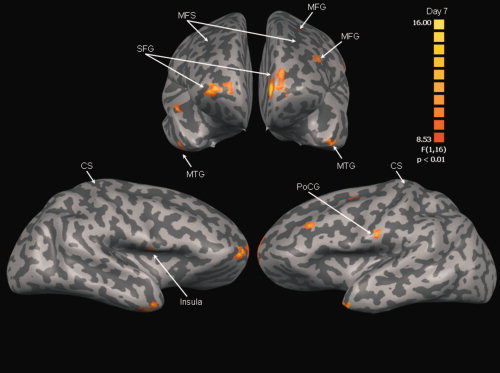
Anterior (top) and lateral (bottom) views of areas demonstrating significant Group × Sequence interaction at retention (Day 7). See Table III for interpretation. The color scale reflects t‐values. MFS, middle frontal sulcus; CS, central sulcus; MFG, middle frontal gyrus; SFG, superior frontal gyrus; MTG, middle temporal gyrus; PoCG, postcentral gyrus.