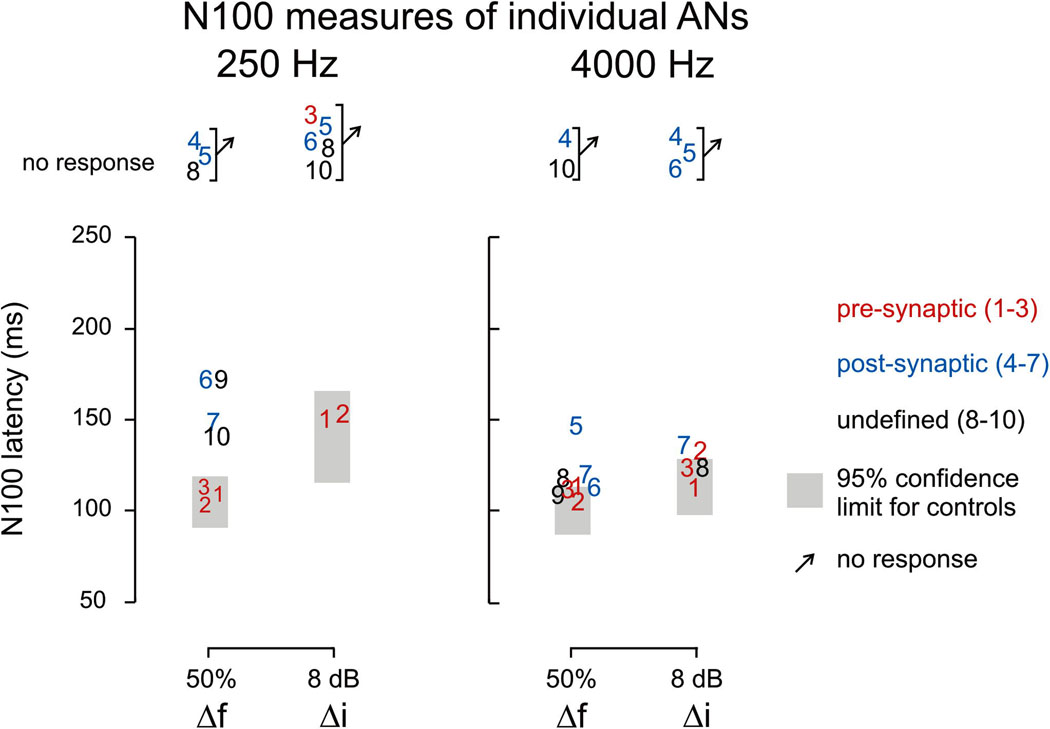
Figure 5.
Scatter plots of N100 latency to frequency and intensity change. Individual AN subjects are represented by digits (corresponding to Table 1) and are color-coded in the figure according to the site of lesion. The 95% confidence limits of the controls are indicated by grey rectangles.

