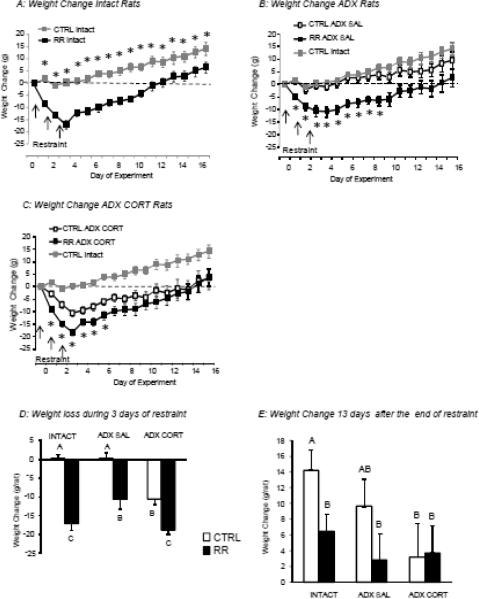
Figure 2.
Body weight change of rats in Experiment 1. Data are means ± sem for groups of 9 or 10 rats. Asterisks in Panels A to C indicate significant differences between CTRL and RR rats within each treatment group. Panel D shows the average weight change of each group of rats during the three days of restraint and Panel E shows the average change in weight for each group from the morning immediately before the first restraint to 13 days after the end of restraint, the last day of the experiment. Data in panels D or E that do not share a common superscript are significantly different at P<0.05.

