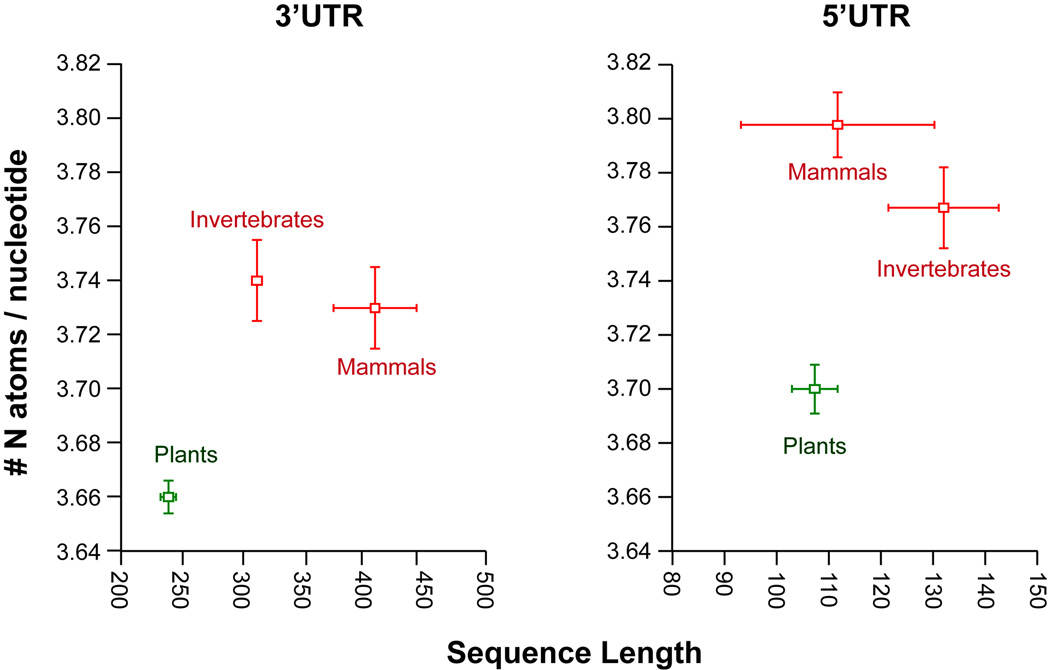
Figure 3.
Nitrogen conservation in plants illustrated by lower average N content per nucleotide and shorter sequence length (exons) of UTRs in plants vs animals. The mean and standard errors are plotted per organisms for a set of invertebrate, mammal, and plant species. Sequence data were obtained from the UTResource and species with information from at least 50 genes were selected; number of species for 3’ and 5’ UTRs were as follows: mammals (13 and 16), invertebrates (61 and 43), and plants (81 and 68).

