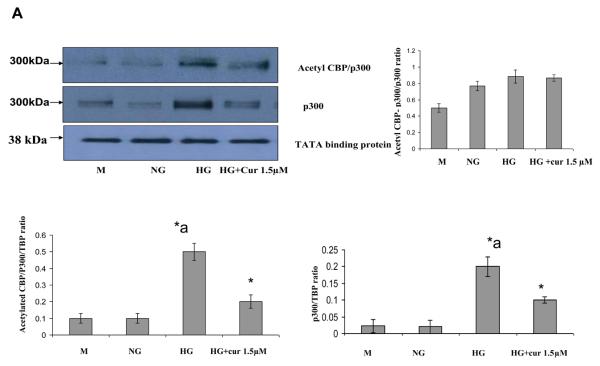
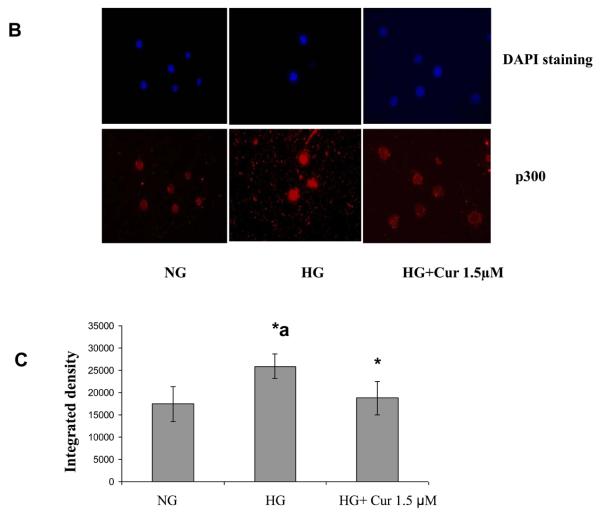
Figure 4. Effect of curcumin on p300 and acetylated CBP/p300 gene expression level in HG –induced THP-1 cells.
(A) Following treatment of cells with various concentrations of curcumin for 72 h as described in Methods, cells were harvested and nuclear lysates were prepared. Protein was subjected to SDS-PAGE as detailed in Materials and Methods Section. Equal loading of protein was confirmed by stripping the immunoblot and reprobing it for TATA binding protein (TBP). The immunoblot shown here is representative of three independent experiments with similar results. (B) Cells were fixed with 4% formaldehyde for 30 min at 4°C and stained overnight at 4 °C with p300 as described in Methods. Data from a typical experiment of 3 are shown; Magnification × 400. *a: p<0.05 compared to NG; *p<0.05 compared to HG. (C) In order to measure Immunostaining intensity of p300, images were captured with a Nikon eclipse TE200 camera (Japan). The signal intensity was measured using ImageJ software *a: p<0.05 compared to NG; *p<0.05 compared to HG.


