
Figure 3.
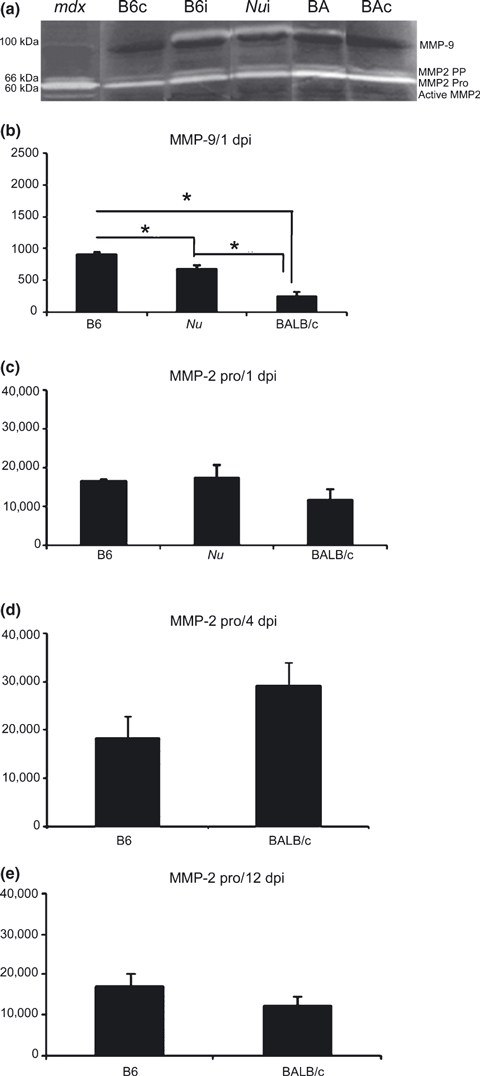
MMP-9 and MMP-2-pro activity in skeletal muscle lesion. (a) Illustrative gelatin zymogram of skeletal muscle (a) 24 h after Bp injection (1 dpi). Mdx = control of muscular lesion, B6 = C57BL/6, BAi = BALB/c, Nu = BALB/cnu/nu, BAc and B6C = control, BAi and B6i = Bp-injection. (b) Semi-quantitative analysis of MMP-9 (b) and MMP-2 (c, d, e) at 1 (a, c), 4 (d) and (e) 12 days after Bp-injection. Activities were quantified by scion Software. Results are expressed as mean (±SD). *P < 0.05.