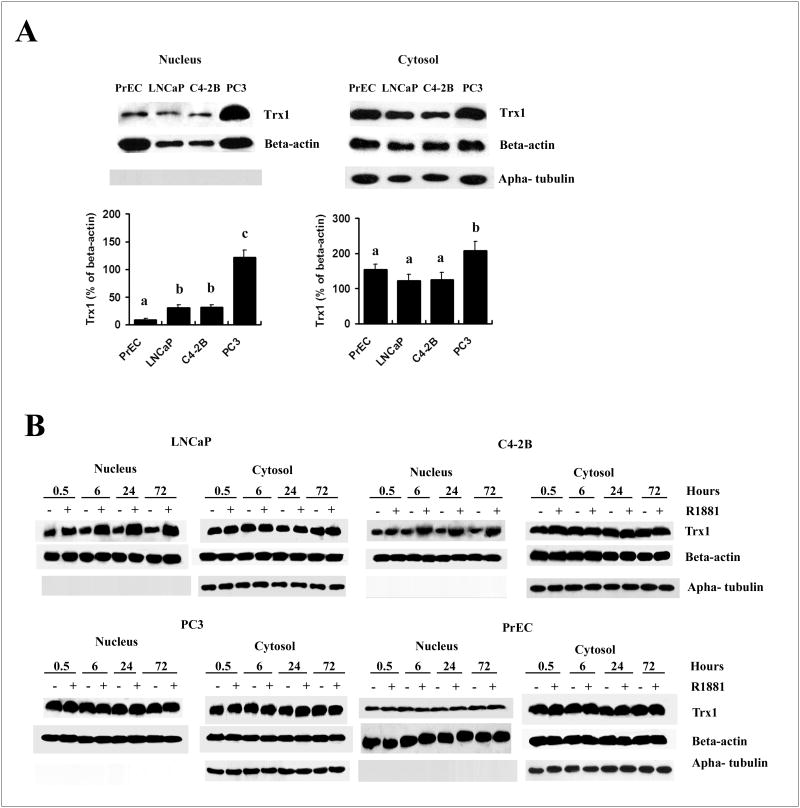
Figure 2. Western blot analysis of effects of R1881 on nuclear and cytoplasmic Trx1 protein expression levels in PrEC and prostate cancer cells.
A, Comparison of Trx1 expression level in the nucleus and cytoplasm with the progression of prostate cancer. Basal level of Trx1 expression in the nucleus and cytoplasm of different cell lines without treatment with R1881 were loaded in the same SDS gel and compared. Data are presented as means ± SD. Means with different letters above bars indicate significant differences (P < 0.05) in each panel. B, Time course of Trx1 protein expression levels in the nucleus or cytoplasm in LNCaP, C4-2B, PC3, or PrEC cells following R1881 treatment at various time points. Cells were treated with ethanol (0.001% EtOH) vehicle control or 1 nM R1881 and nuclear and cytoplasmic proteins were processed as outlined in Materials and Methods. Purity of the nuclear fractions was assured by immunoblotting with an anti-alpha-tubulin antibody. Protein loading: 50 μg for nuclear proteins and 30 μg for cytoplasmic proteins.

