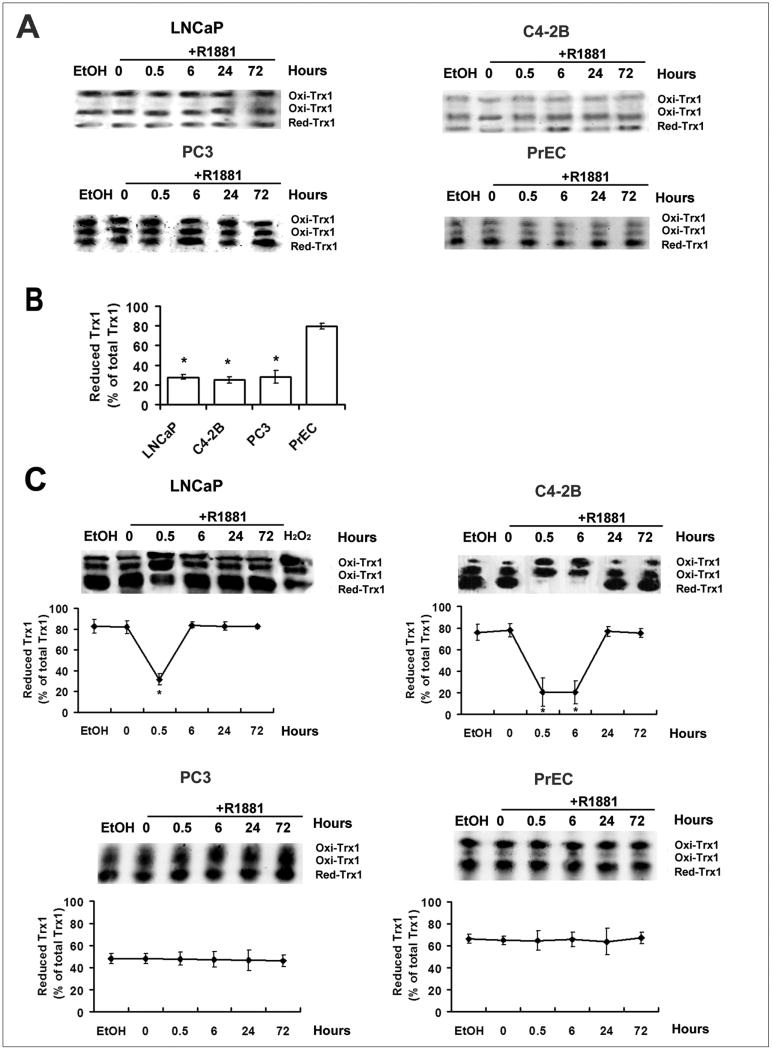
Figure 3. Redox western blot analysis of effects of R1881 on redox states of nuclear and cytoplasmic Trx1 in PrEC and prostate cancer cells.
A and C, Time course of Trx1 reduction/oxidation in the nucleus (A), and cytoplasm (C) of PrEC, LNCaP, C4-2B or PC3 cells following R1881 treatment at various time points. B, Comparison of nuclear Trx1 redox states in prostate cancer cells with PrEC cells. Cells were treated with ethanol (0.001% EtOH) vehicle control or 1 nM R1881. Nuclear or cytoplasmic proteins were processed as outlined in Materials and Methods. Redox forms of Trx1 are indicated as follows: red, reduced form; oxi, oxidized form (disulfide in active site); the top oxi band representing the most oxidized form (disulfides in active site and outside active site). H2O2 (0.1 mM, 10 min) treated cellular extracts were used as a positive control. The percentage of Trx1 in the reduced form was calculated by the formula % Reduced= reduced Trx1/total Trx1 (total of 3 bands). Data are presented as means ± SD. *, p<0.05 compared with control.

