
Figure 1.
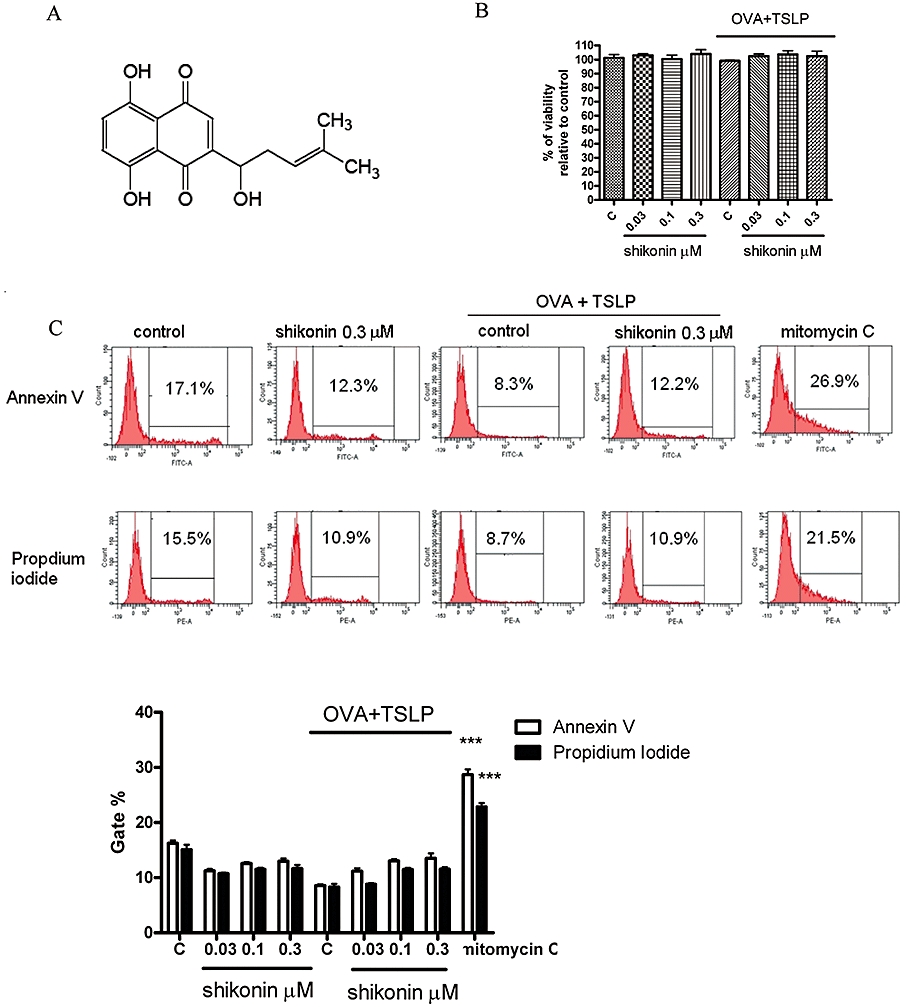
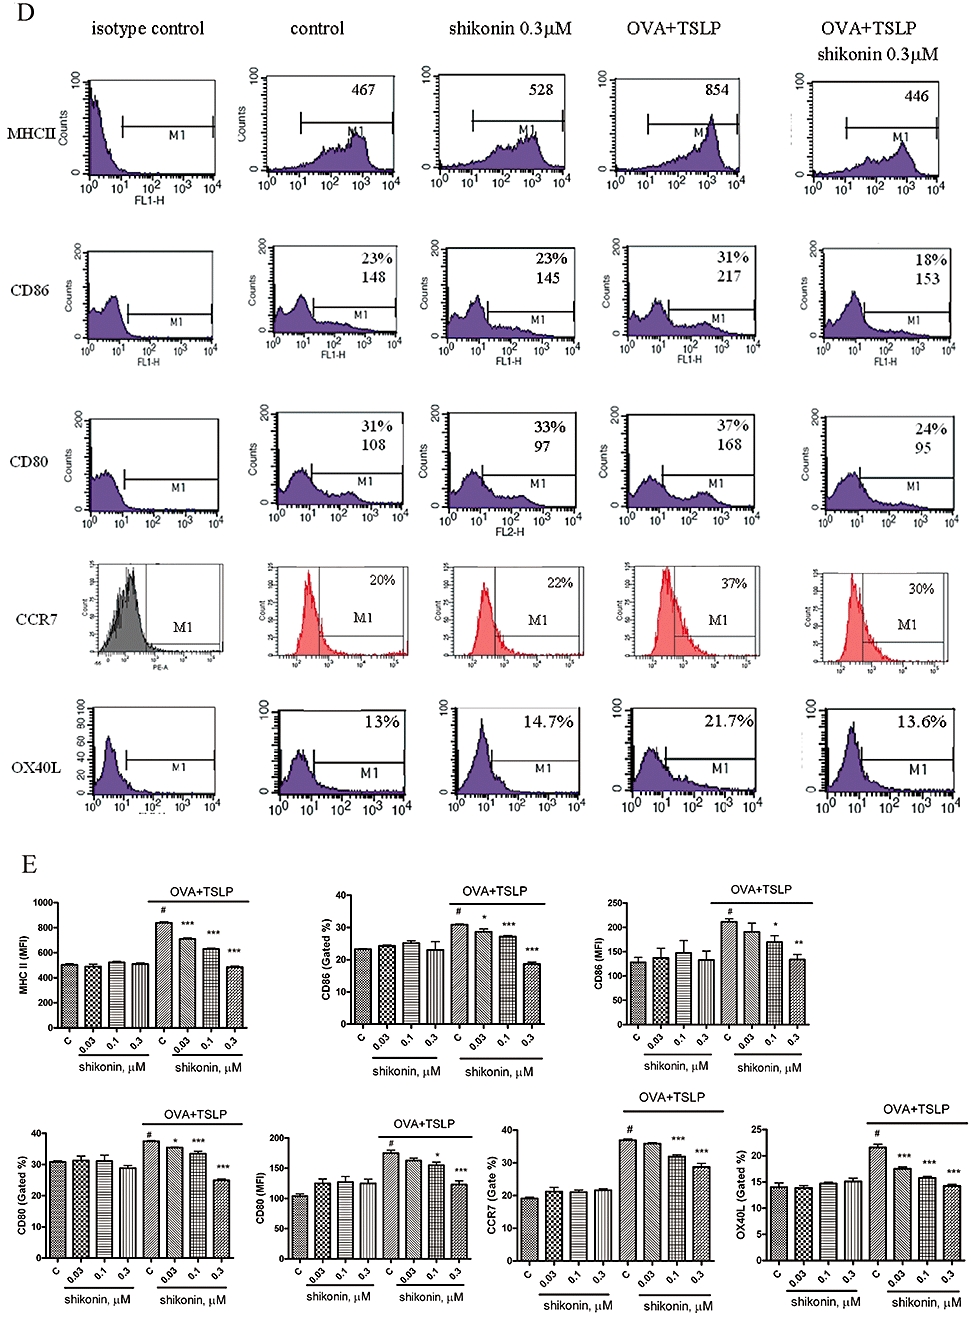
Shikonin inhibited the expression of surface markers on murine bone marrow-derived dendritic cells (BM-DCs). (A) Chemical structure of shikonin. (B) BM-DCs were prepared as described in Methods. BM-DCs were treated with shikonin for 10 min, then cultured with or without 100 µg·mL−1 ovalbumin (OVA) combined with 20 ng·mL−1 thymic stromal lymphopoietin (TSLP) for 48 h; cell viability was detected by Trypan blue exclusion. (C) Cells were stained with fluorescein isothiocyanate-labelled Annexin V and propidium iodide, and cell apoptosis was analysed by flow cytometry as described in Methods. BM-DCs treated with 25 µg·mL−1 mitomycin C for 6 h were used as a positive control. Histograms represent quantification of apoptosis % by gated region, which was analysed by flow cytometry. Data were expressed as mean ± SEM (n = 3). ***P < 0.001, compared with the control group (no treatment; C). (D) BM-DCs were treated with shikonin for 10 min and then cultured with or without 100 µg·mL−1 OVA combined with 20 ng·mL−1 TSLP for 48 h. Expression of surface markers was analysed by flow cytometry. The values shown in the flow cytometry profiles are the gated % and the mean fluorescence intensity indexes. Cells were gated on CD11c, and the incidence of CD11c+ cells expressing the antigen of interest is indicated within each histogram. (E) Histograms represent quantification of surface marker expression analysed by flow cytometry. Data were expressed as mean ± SEM (n = 3–6). #P < 0.001, compared to the control, without OVA + TSLP, group. *P < 0.05; **P < 0.01; ***P < 0.001, compared to the control, with OVA + TSLP, group. MHC, major histocompatibility complex.