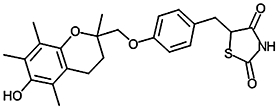
Table 2.
Inhibition of NPA hydrolysis in hMGL lysates by PPARγ ligands
| Compound | Structure | hMGL pI50[IC50 (µM)] | rat brain FAAH IC50 (µM) | PPARγ EC50 (µM) (h/m) |
|---|---|---|---|---|
| Troglitazone |  |
5.94 ± 0.03 (1.2) | ∼200 µMa | 0.55/0.78b |
| Ciglitazone |  |
5.60 ± 0.05 (2.5) | 84 µMa | −/3c |
| Rosiglitazone |  |
4.53 ± 0.04 (29) | ∼200 µMa | 0.043/0.076b |
| CAY 10415 |  |
4.31 ± 0.04 (49) | ||
| 15-deoxy-Δ12,14-prostaglandin J2 |  |
4.32 ± 0.06 (48) | 87 µMa | −/2d |
| CAY 10514 |  |
<4 (>100) | 0.64/−e |
The pI50 values and hence IC50 values were calculated from the raw data shown in Figure 1B, using hMGL lysates (catalogue no. #10008354) and 0.25 mM NPA.
The FAAH data are for rat brain homogenates, 0.5 µM [3H]AEA as substrate, and an assay pH of 7.4, and are taken from Lenman et al. (2007). The PPARγ values for troglitazone, ciglitazone, rosiglitazone, 5-deoxy-Δ12,14-prostaglandin J2 and CAY10514 are for transactivation assays using human (h) or mouse (m) chimeric receptors and are from
Note that CAY10514 showed a low efficacy compared with rosiglitazone, which in the same study reported to have an EC50 value of 0.004 µM. Comparable data are not (to our knowledge) reported for CAY10415. However, this compound increases insulin-stimulated inccorporation of [14C]acetate into lipid in differentiated mouse 3T3-L1 cells at 3–10 µM concentrations (Tanis et al., 1996).
